Free Access
Fig. 5.
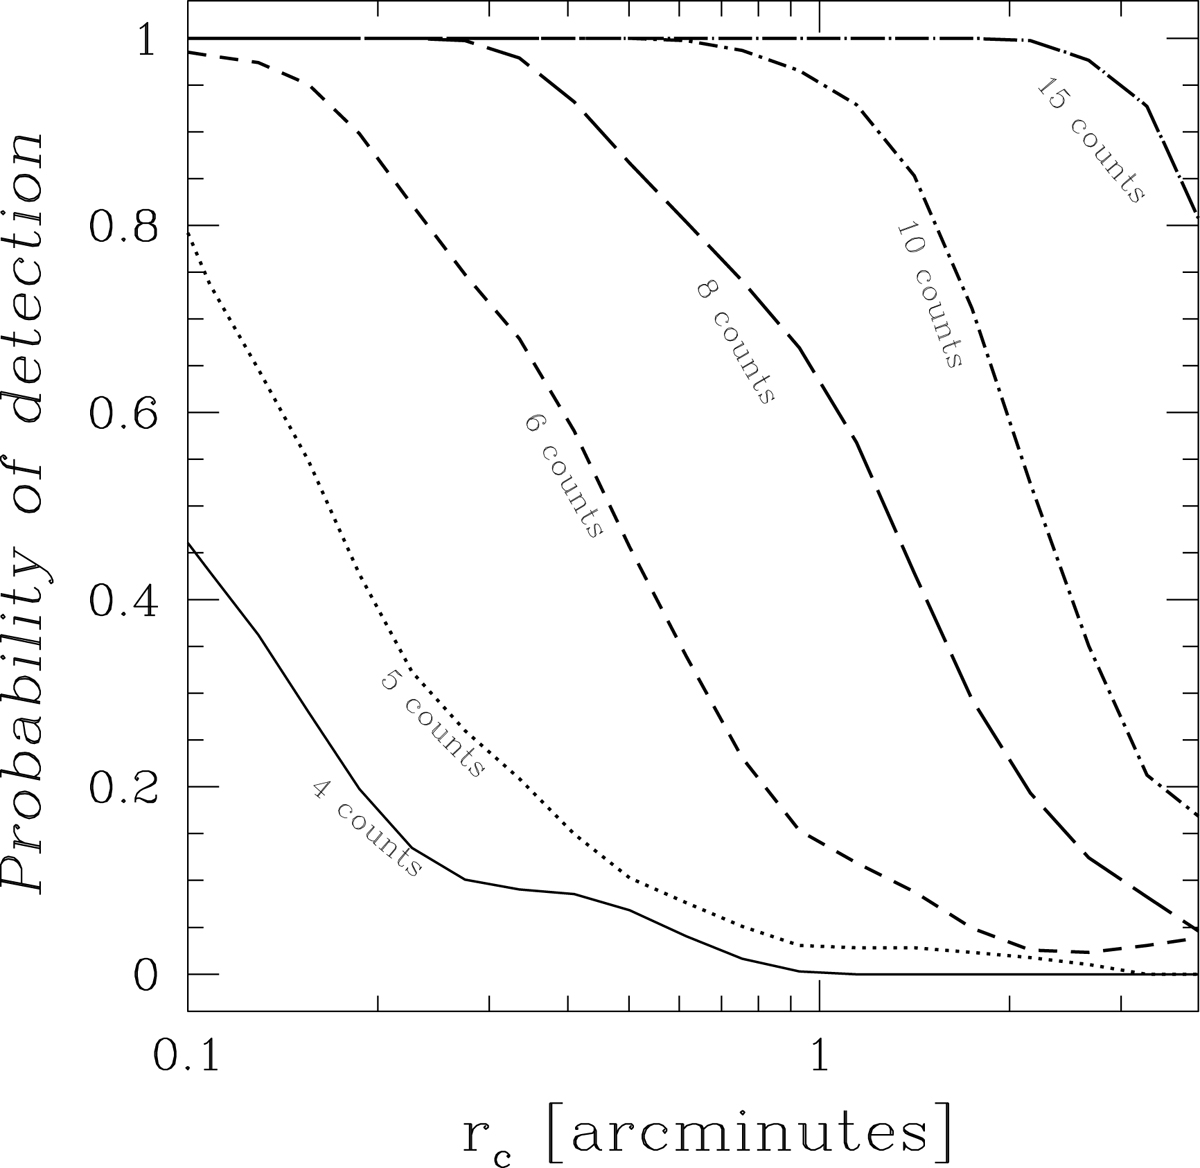
Probability of cluster detection as a function of its core radius P(I|rc, ηob, β(μ)). The solid, dotted, dashed, long-dashed, dashed-dotted, long-dashed-dotted curves denote the calculation for ηob of 4, 5, 6, 8, 10, 15 counts, respectively. The range of core radii shown represent the cluster sample at a redshift of 0.25.
Current usage metrics show cumulative count of Article Views (full-text article views including HTML views, PDF and ePub downloads, according to the available data) and Abstracts Views on Vision4Press platform.
Data correspond to usage on the plateform after 2015. The current usage metrics is available 48-96 hours after online publication and is updated daily on week days.
Initial download of the metrics may take a while.