Fig. 4.
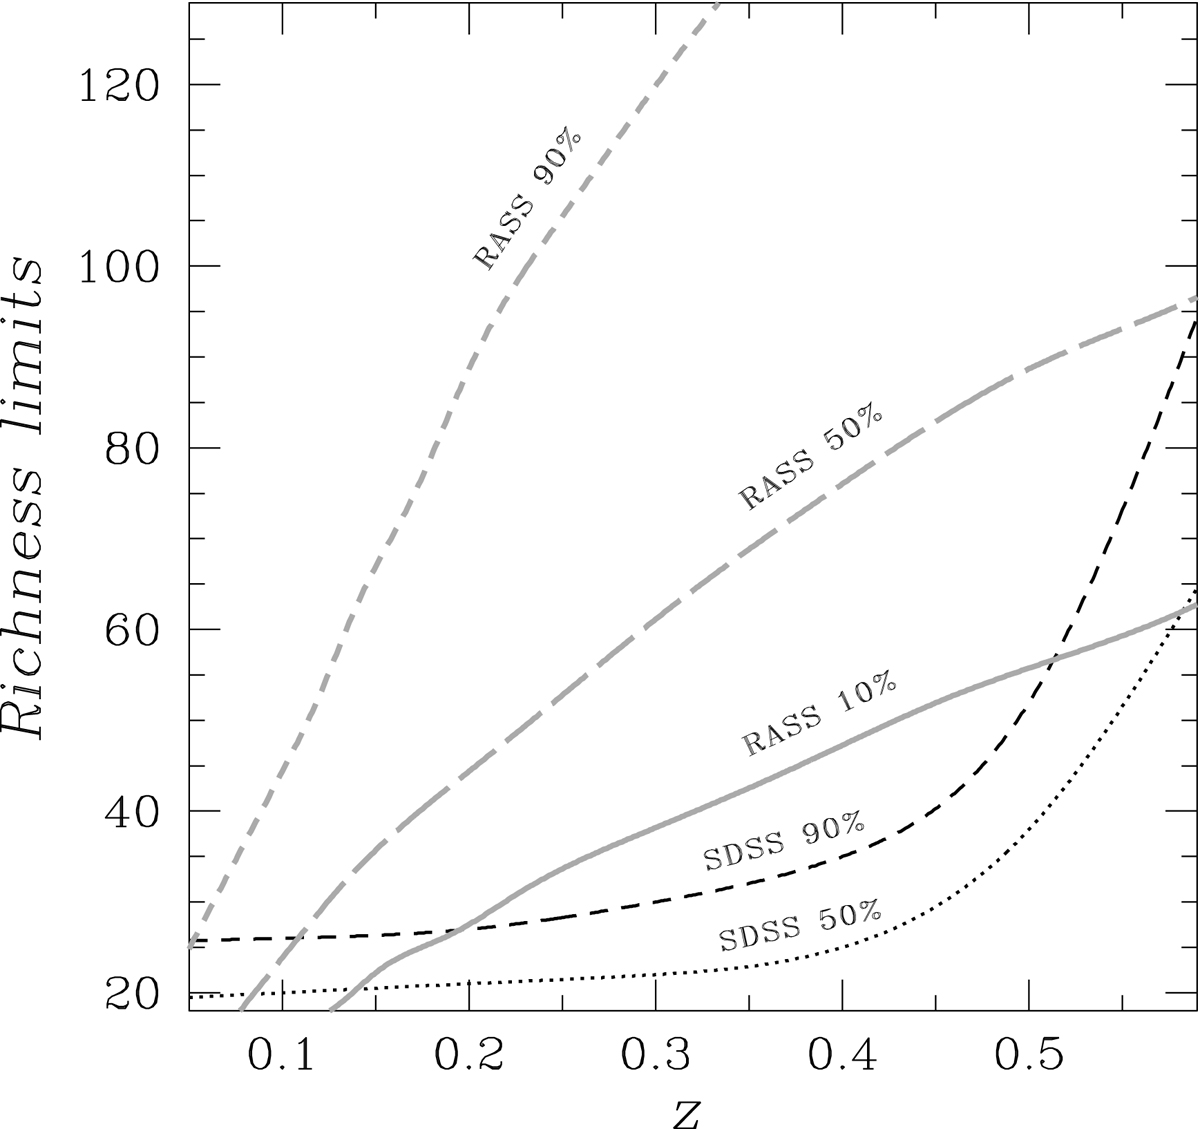
Richness limits of the survey. The black curves show the 90% (dashed) and 50% (dotted) completeness limits PSDSS of redMaPPer cluster confirmation via SDSS data (Rykoff et al. 2014). The gray curves indicate the 10% (solid), 50% (long-dashed) and 90% (short-dashed) completeness limits of the RASS. The 10% curve also serves as a limit for low (5%, Klein et al. 2019) contamination subsample and is adopted as our selection PRASS.
Current usage metrics show cumulative count of Article Views (full-text article views including HTML views, PDF and ePub downloads, according to the available data) and Abstracts Views on Vision4Press platform.
Data correspond to usage on the plateform after 2015. The current usage metrics is available 48-96 hours after online publication and is updated daily on week days.
Initial download of the metrics may take a while.