Free Access
Fig. 3.
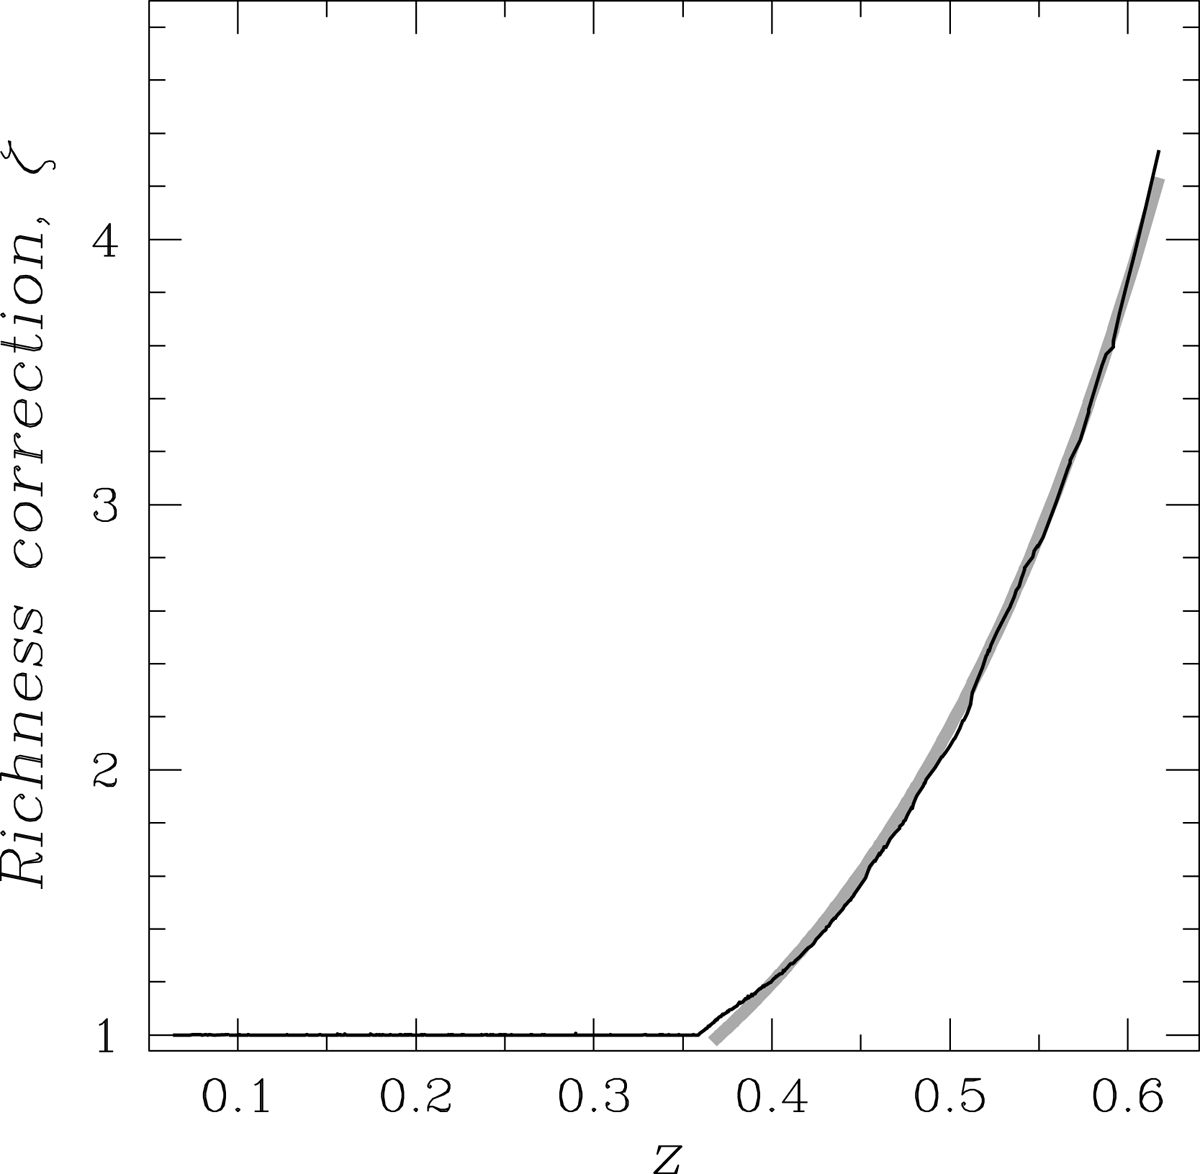
Multiplicative richness correction due to photometric depths of the SDSS survey. The black histogram shows the actual correction applied and the gray curve shows our approximation of it as ζ = e5.5(z − 0.35) − 0.12 at z > 0.37.
Current usage metrics show cumulative count of Article Views (full-text article views including HTML views, PDF and ePub downloads, according to the available data) and Abstracts Views on Vision4Press platform.
Data correspond to usage on the plateform after 2015. The current usage metrics is available 48-96 hours after online publication and is updated daily on week days.
Initial download of the metrics may take a while.