| Issue |
A&A
Volume 637, May 2020
|
|
|---|---|---|
| Article Number | C5 | |
| Number of page(s) | 6 | |
| Section | Celestial mechanics and astrometry | |
| DOI | https://doi.org/10.1051/0004-6361/201936161e | |
| Published online | 20 May 2020 | |
The Gaia reference frame for bright sources examined using VLBI observations of radio stars (Corrigendum)
Lund Observatory, Department of Astronomy and Theoretical Physics, Lund University, Box 43, 22100 Lund, Sweden
e-mail: lennart@astro.lu.se
Key words: astrometry / proper motions / reference systems / instrumentation: interferometers / methods: data analysis / errata, addenda
This is a corrigendum to Lindegren (2020). Owing to a coding error in the implementation of the analysis method described in the paper, the results obtained from its application to Gaia DR2 data were significantly wrong. Although the main conclusions of the original paper remain unchanged, the results presented in Tables 2 and 3, Figs. 3–5, and Sects. 3.3, 3.4, 4, and 5 are substantially affected. The revised tables, figures, and portions of the text are given below.
3.3. Results
The direct application of the solution method in Sect. 2.3 to the full sample of 41 sources gives a very poor fit as measured by the loss function Q ≃ 2 176 000 for n ≡ ∑ini = 224 degrees of freedom, or a reduced chi-square of Q/n ≃ 9713. This solution also gives unrealistically large values for the spin parameters, where  mas yr−1. Inspection of the discrepancy measure Qi/ni of the individual sources shows that T Tau has by far the highest value at Qi/ni ≃ 247 502, followed by S Crt at Qi/ni ≃ 123 397, and so on. Removing T Tau from the sample and re-computing the solution and discrepancy measures gives Q ≃ 924 169 for n = ∑ini = 219 degrees of freedom (Q/n ≃ 4220). In this solution the source with the largest discrepancy measure is S Crt at Qi/ni ≃ 123 714. Removing this source as well and iterating the procedure until all sources but one have been removed gives a series of solutions with k = 0, 1, … rejected sources. The evolution of max(Qi/ni) and Q/n as functions of k is shown in the left panels of Fig. 3; the corresponding orientation and spin parameters are shown in the rightpanels.
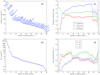 |
Fig. 3. Evolution of discrepancy measures and rotation parameters in a series of solutions for which the k most discrepant sources have been removed. (a) Discrepancy measure Qi/ni for the most discrepant source in the solution. Points are labelled with the name of the source. (b) Total discrepancy measure Q/n as a function of the number of rejected sources. (c) Estimated orientation parameters and (d) spin parameters as functions of the number of rejected sources. Error bars are formal ±1σ uncertainties from the inverse normal matrix, i.e. not adjusted depending on the goodness-of-fit. |
Errors in the rotation parameters caused by non-linear source motions and other model deficiencies are generally reduced as more outliers are removed, while the statistical (formal) uncertainties increase because fewer sources contribute to the solution. The optimum solution is a compromise between the opposite tendencies and may be found somewhere along the sequence of solutions described above. The rather smooth progression of the discrepancy measures in Figs. 3a and b gives no clear indication of the optimum k, except that it is probably in the range from 7 (removing the seven most obvious outliers) to ≃ 33 (after which Q/n < 1). The spin parameters in Fig. 3d show an abrupt change with the removal of HD 282630 at k = 13, after which the fluctuations, although not negligible, are roughly of a size that is compatible with the formal uncertainties. For the subsequent discussion we assume, somewhat arbitrarily, the solution at k = 15 as the baseline1. This solution has Q/n = 5.68 with n = 139 degrees of freedom and the most discrepant source is PZ Cas with Qi/ni ≃ 28.604.
The accepted and rejected sources and their individual discrepancy measures for the baseline solution are listed in Table 2. The rotation parameters are given in Table 3 under entry A, including the formal uncertainties calculated from the inverse normal matrix. The correlation matrix (for T = J2015.5) is
![$$ \begin{aligned} \begin{aligned}&\text{ corr}\,\Bigl [\varepsilon _X(T),~\varepsilon _Y(T),~\varepsilon _Z(T), ~\omega _X,~\omega _Y,~\omega _Z\Bigr ]\\&\quad =\begin{bmatrix} +1.000\!&+0.517\!&+0.204\!&+0.136\!&+0.066\!&+0.120\\ +0.517\!&+1.000\!&+0.206\!&+0.099\!&+0.131\!&+0.105\\ +0.204\!&+0.206\!&+1.000\!&+0.091\!&+0.035\!&+0.133\\ +0.136\!&+0.099\!&+0.091\!&+1.000\!&-0.028\!&+0.405\\ +0.066\!&+0.131\!&+0.035\!&-0.028\!&+1.000\!&-0.090\\ +0.120\!&+0.105\!&+0.133\!&+0.405\!&-0.090\!&+1.000\\ \end{bmatrix}. \end{aligned} \end{aligned} $$](/articles/aa/full_html/2020/05/aa36161e-19/aa36161e-19-eq2.gif)
Gaia DR2 matches and solution statistics for the radio sources in Table 1.
Summary of the different solutions for the orientation and spin parameters.
Given the reduced chi-square of the solution, Q/n ≃ 5.68, it is likely that the formal uncertainties underestimate the actual errors. More realistic estimates may be obtained by bootstrap resampling of the 26 accepted sources, yielding the uncertainties in the ‘Adopted’ entry of Table 3.
From the original sample of m = 41 sources, k = 15 were thus removed to obtain the baseline subset of m − k = 26 sources. It is not obvious that the process of successively removing the most discrepant source leads to the optimum subset in the sense that no other subset of the same size has a smaller Q/n. It is conceivable that a different procedure, for instance, starting from a smaller subset and adding the best-fitting sources (outward selection; Ben-Gal et al. 2010), would lead to a different result. While it is impractical to test all  possible combinations, an exhaustive search of the
  different subsets of size 26 drawn from the 33 sources with the smallest discrepancy measure did not uncover a more favourable subset. Figure 4 shows Q/n versus the spin components for these solutions. Many of these solutions are very different from the baseline solution in terms of the spin components, but invariably their Q/n is then also significantly higher. This makes it credible that the spin parameters of the adopted solution are not the chance result of a particular combination of data for a few sources.
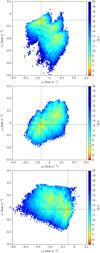 |
Fig. 4. Sensitivity of the solution to the selection of sources. The plots show the spin parameters and associated Q/n values for about four million solutions using different subsets of the sources as described in the text. The colour shows the smallest Q/n in each bin. The dashed lines denote the spin parameters for the baseline solution A with Q/n ≃ 5.68. |
The solution gives improved estimates of the astrometric parameters of the sources, obtained by solving (21) for each i. These results are not tabulated, as they are practically the same as a weighted average of the data obtained by very long baseline interferometry (VLBI) and the Gaia data, after correcting the latter for the frame rotation and parallax zero-point. For example, the joint estimate of the parallax of Cyg X-1 is  mas, which is very close to the weighted mean of the VLBI value, 0.547 ± 0.041 mas, and the Gaia DR2 value after correction for the zero-point, 0.472 ± 0.032 mas.
3.4. Alternative solutions
The classical way to determine ω is to solve the over-determined system of Eqs. (8) and (9) using only the proper motion differences. In this process it is natural to assign a weight to each equation that is inversely proportional to the combined variances of the VLBI and Gaia proper motions. An equivalently weighted least-squares solution is obtained with the formalism of Sect. 2.3 simply by deleting in fi all the VLBI data items that are not proper motions. The resulting normal equations, Eq. (22), are of course singular for the orientation parameters, but the lower right 3 × 3 part of the equations gives the desired solution for ω. Applying this procedure to the baseline subset of 26 sources gives the result shown as solution B in Table 3. The spin parameters are reasonably close to those of the baseline solution (A) for the X and Z components, while the Y component shows a more negative value. It is more interesting, however, that the formal uncertainties are significantly higher in solution B than in A: the uncertainty is a factor two higher for the Y component.
It thus appears that the positional VLBI data are at least as valuable as the proper motion data when estimating the spin, at least for the spread of VLBI epochs considered in this work. A direct test of this hypothesis is to make the complementary solution to what is described above, that is, deleting all proper motion items in fi. The result is shown as solution C in Table 3. In this case, the spin is more precise (in terms of formal uncertainties) than in solution B where (only) the proper motions are used, although not as precise as in A. It can be noted that only 23 of the 26 sources contribute to solution C because no positional VLBI data are provided for S CrB, U Her, and RR Aql, although these sources belong to the baseline subset.
Figure 4 of Lindegren et al. (2018) suggests that the transition from the faint to the bright reference frame in Gaia DR2 does not occur abruptly at G = 13, but happens gradually from G ≃ 13 to ≃11 mag. Several of the sources in Table 1 have magnitudes in the transition interval and may therefore not contribute fully to the determination of the rotation parameters. In solution D the model of the Gaia data in (11) is modified so that the applied rotation is x multiplied by the magnitude-dependent function
This improves the overall fit significantly (Q = 747.6 in D against 789.5 in A), although the discrepancy measure increases for two of the six accepted sources in the magnitude range 11–13 (V1961 Ori and DoAr 51). The VLBI data therefore support the magnitude dependent model, although not unambiguously. The resulting rotation parameters (for G ≲ 11) are not significantly different from the baseline solution.
4. Discussion
4.1. Estimated rotation parameters
The results in Table 3 yield a spin for the Gaia DR2 bright reference frame of ω = (−0.068,−0.051,−0.014) mas yr−1, which is not statistically significant in view of the uncertainties obtained by the bootstrap method. Nevertheless, the consistently negative values of ωX and ωY obtained for a wide range of k in Fig. 3d do suggest a marginally significant spin of the order of 0.1 mas yr−1. This is supported by the qualitative agreement between solutions B and C, which use different subsets of the VLBI data.
With regard to the orientation parameters ε(2015.5), the Y and Z components are statistically significant in view of the uncertainties obtained by the bootstrap method and indicate a total orientation error of about 1.4 mas. The large uncertainty of the Y component reflects the unfavourable celestial distribution of the more recent VLBI observations included in the analysis (Sect. 3.5).
As mentioned in the Introduction, the non-zero spin of the bright reference frame of Gaia DR2 is also seen in a comparison with proper motions of HIPPARCOS stars calculated from the position differences between Gaia DR2 and the HIPPARCOS catalogue, divided by the ∼24 yr epoch difference. This comparison was made by Brandt (2018) in the course of constructing The HIPPARCOS–Gaia Catalog of Accelerations (HGCA). For 115 663 HIPPARCOS stars the HGCA gives three essentially independent sets of proper motions, namely (i) as measured byHIPPARCOS around epoch 1991.25, (ii) as measured by Gaia (in DR2) around epoch 2015.5, and (iii) as calculated from the HIPPARCOS–Gaia position differences divided by the epoch difference. The HGCA is intended for orbit fitting and for identifying candidate stars with substellar or dark companions. To this end, Brandt (2018) made a careful cross-calibration of the three sets of proper motions in order to eliminate any systematic offsets, in particular the global rotations. For the rotation between sets (ii) and (iii) the result as given in Brandt’s Table 1 is ω = (−0.081,−0.113,−0.038) mas yr−1. Brandt used the same sign convention for this vector as in this paper, so that his result can be directly compared with our Table 3.
The comparison with Brandt (2018) rests on the assumption that the HIPPARCOS–Gaia position differences yield proper motions that are absolute; that is, they are expressed in a reference frame that is non-rotating with respect to the International Celestial Reference System (ICRS).2 The validity of this assumption depends on the quality of the positional reference frame of HIPPARCOS at epoch 1991.25 and of the positional reference frame for the same stars in Gaia DR2 at epoch 2015.5. If both sets of positions are aligned with the ICRS at their respective epochs, the proper motions calculated from the position differences must clearly be non-rotating with respect to the ICRS.
According to the present analysis, the bright reference frame of Gaia DR2 was however offset from ICRS by more than 1 mas at epoch 2015.5, as given by ε(2015.5) in Table 3. To take this into account in the spin comparison, Brandt’s estimate quoted above needs to be increased by ε(2015.5)/(24.25 yr). This yields the corrected estimate of ω = (−0.082,−0.059,−0.015) mas yr−1, which is in good agreement with the adopted spin solution in Table 3. The uncertainty of this estimate is  mas yr−1 per axis, which was obtained by combining the RMS orientation error of the HIPPARCOS reference frame at epoch 1991.25 (in Vol. 3, Sect. 18.7 of The HIPPARCOS and Tycho Catalogues, ESA 1997, given as 0.6 mas per axis) and the uncertainty of ε(2015.5), taken to be 0.4 mas.
The old HIPPARCOS positions thus provide an independent estimate of the spin, which agrees with the results from the VLBI observations and is of comparable or even better accuracy. However, because its uncertainty is dominated by the unknown orientation errors of the HIPPARCOS reference frame, which will not improve, the method will be of limited value for the validation of future Gaia data releases. In contrast, the VLBI method, as discussed in Sect. 4.4, has great potential for future improvement.
The origin of the non-zero rotation parameters for the bright reference frame of Gaia DR2 is a deficiency in the specific instrument calibration model used for the DR2 astrometric solution. The relevance of this deficiency for the reference frame was not recognised at the time when the DR2 data were prepared and validated, and although its effect on the bright sources was noted (e.g. Fig. 4 in Lindegren et al. 2018), no explanation of its origin was offered. This is now understood, and the calibration model is being improved with a view towards avoiding a similar error in future data releases (see Appendix B).
4.3. Binarity and source structure
In Fig. 5 the source DoAr 51 stands out because it has a large RUWE = 6.43, while obtaining a reasonable fit in the solution (Qi/ni = 7.127). This object is a triple system consisting of an equal-mass pair with a period of about eight years, a separation of approximately 56 mas at 2015.5, and a fainter tertiary component at a separation of about 790 mas (Schaefer et al. 2018). This triple configuration could explain the high RUWE obtained with Gaia. The VLBI observations detect both components of the close pair, and the data in Table 1 refer to their centre of mass (Ortiz-León et al. 2017). The near-coincidence of the VLBI and Gaia epochs, together with the near-coincidence of the optical photocentre with the centre of mass of the close pair and the rather large uncertainty of the Gaia proper motion (∼1 mas yr−1), could explain why the discrepancy measure is not higher. With Ωi = 3.2 mas−2 yr2, this object contributes less to the determination of ω than any of the other accepted sources in Table 2. DoAr 51 is a good example of an object for which an extended model along the lines in Sect. 2.4 could drastically increase the usefulness of the data.
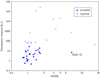 |
Fig. 5. Discrepancy measures of the sources in solution A against the RUWE in the Gaia DR2 astrometry. The case of DoAr 51 is discussed in Sect. 4.3. |
5. Conclusions
This paper provides a rigorous mathematical framework for estimating the orientation and spin of the Gaia reference frame, in which the Gaia data are optimally combined with VLBI measurements of bright radio sources. The simultaneous estimation of the orientation (ε) and spin (ω) is essential for achieving the best accuracy. The method takes full advantage of past and future single-epoch VLBI measurements of Gaia sources for the determination of the spin. Independent estimates of their proper motions from VLBI can be incorporated into the solution, but are not required by the method.
Applied to published VLBI data for a sample of 41 bright (G ≤ 13 mag) radio sources, the method gives the rotation parameters summarised in Table 3. The solution retains 26 of the investigated radio sources, while 15 are rejected based on a statistical discrepancy measure sensitive to binarity and source structure. The results indicate that the bright reference frame of Gaia DR2 at the reference epoch 2015.5 is offset from the ICRS by about 1.3 mas in Y and 0.6 mas in Z. The solution for the spin indicates a rotation rate of the order of 0.1 mas yr−1. The components of the spin solution are not statistically significant incomparison with their uncertainties from the bootstrap method. Nevertheless, they agree well with independent estimates obtained from a comparison of the extrapolated Gaia DR2 positions with the HIPPARCOS catalogue at epoch J1991.25 (Lindegren et al. 2018; Brandt 2018) if the latter estimates are corrected for the alignment error of Gaia DR2 at the Gaia epoch. The accuracy of the present study is limited by the relatively small number of radio stars included, by the uncertainties of the Gaia DR2 proper motions, and by issues related to the astrophysical nature of the sources.
The origin of the spin of the bright reference frame of Gaia DR2 is understood and measures have been taken to to avoid this problem in future data releases (see Appendix B). Nevertheless, it is important that the consistency of future reference frames can be validated across the full range of magnitudes and the present method offers such a possibility for the bright stars. As many as possible of the already existing VLBI measurements of radio stars should be used for this purpose, but it is very desirable to complement this by re-observing many of these sources in the coming years, and if possible, add new targets to the list for improved robustness. The use and re-calibration of old, possibly unpublished data should be pursued. In this context, the unique historical value of positional VLBI measurements needs to be stressed. As argued in Sect. 4.5, observers should ensure that relevant intermediate data and meta-information are preserved for optimal future uses of their data.
This choice of k is the same as made in the original version of this paper. Although that choice, based on an incorrect computation, is in principle irrelevant for the present analysis, the corrected results do not present a clear case for adopting a different k. As it happens, k = 15 results in exactly the same subset of rejected radio sources as in the original paper.
Brandt (2018) adopted the (bright) reference frame of Gaia DR2 for the HGCA, therefore the published proper motions of type (iii), called pmra_hg and pmdec_hg in his Table 5, are not absolute in our sense. To place these values on the ICRS, the applied cross-calibration corrections must be subtracted, i.e. use pmra_hg–crosscal_pmra_hg and pmdec_hg–crosscal_pmdec_hg.
Acknowledgments
The coding error affecting the numerical results in the original version of the paper was discovered by S. Lunz (Potsdam). I am deeply grateful for her careful checking and perseverance in hunting down the bug.
References
- Ben-Gal, I. 2010, in Data Mining and Knowledge Discovery Handbook, 2nd edn., eds. O. Maimon, & L. Rokach (Springer, Boston, MA), 117–130 [Google Scholar]
- Brandt, T. D. 2018, ApJS, 239, 31 [NASA ADS] [CrossRef] [Google Scholar]
- ESA 1997, The Hipparcos and Tycho Catalogues (Noordwijk: ESA), ESA SP-1200 [Google Scholar]
- Lindegren, L. 2018, Gaia technical note GAIA-C3-TN-LU-LL-124. http://www.rssd.esa.int/doc_fetch.php?id=3757412 [Google Scholar]
- Lindegren, L. 2020, A&A, 633, A1 [NASA ADS] [CrossRef] [EDP Sciences] [Google Scholar]
- Lindegren, L., Hernández, J., Bombrun, A., et al. 2018, A&A, 616, A2 [NASA ADS] [CrossRef] [EDP Sciences] [Google Scholar]
- Ortiz-León, G. N., Loinard, L., Kounkel, M. A., et al. 2017, ApJ, 834, 141 [NASA ADS] [CrossRef] [Google Scholar]
- Schaefer, G. H., Prato, L., & Simon, M. 2018, AJ, 155, 109 [NASA ADS] [CrossRef] [Google Scholar]
© ESO 2020
All Tables
All Figures
|
Fig. 3. Evolution of discrepancy measures and rotation parameters in a series of solutions for which the k most discrepant sources have been removed. (a) Discrepancy measure Qi/ni for the most discrepant source in the solution. Points are labelled with the name of the source. (b) Total discrepancy measure Q/n as a function of the number of rejected sources. (c) Estimated orientation parameters and (d) spin parameters as functions of the number of rejected sources. Error bars are formal ±1σ uncertainties from the inverse normal matrix, i.e. not adjusted depending on the goodness-of-fit. |
| In the text | |
|
Fig. 4. Sensitivity of the solution to the selection of sources. The plots show the spin parameters and associated Q/n values for about four million solutions using different subsets of the sources as described in the text. The colour shows the smallest Q/n in each bin. The dashed lines denote the spin parameters for the baseline solution A with Q/n ≃ 5.68. |
| In the text | |
|
Fig. 5. Discrepancy measures of the sources in solution A against the RUWE in the Gaia DR2 astrometry. The case of DoAr 51 is discussed in Sect. 4.3. |
| In the text | |
Current usage metrics show cumulative count of Article Views (full-text article views including HTML views, PDF and ePub downloads, according to the available data) and Abstracts Views on Vision4Press platform.
Data correspond to usage on the plateform after 2015. The current usage metrics is available 48-96 hours after online publication and is updated daily on week days.
Initial download of the metrics may take a while.