Fig. 6.
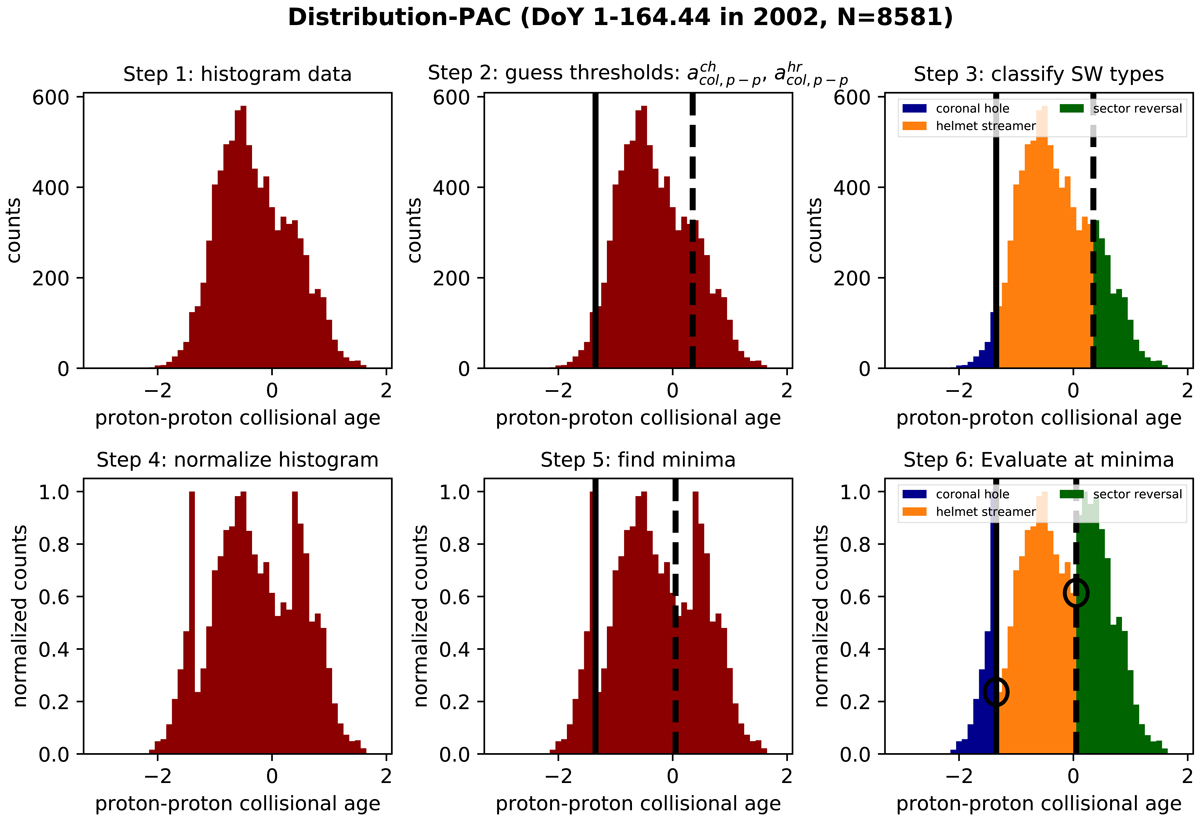
Distribution-PAC method for one time frame (DoY 1−164.44 in 2002). Each panels shows one-dimensional histograms of the proton-proton collisional age. In the second row, all histograms are normalized to their respective maxima. Solid and dashed vertical lines indicate classification thresholds. The circles in the last panel in the second row indicate the histogram values used for the evaluation of the candidate solution. The sample size N is given in the figure title.
Current usage metrics show cumulative count of Article Views (full-text article views including HTML views, PDF and ePub downloads, according to the available data) and Abstracts Views on Vision4Press platform.
Data correspond to usage on the plateform after 2015. The current usage metrics is available 48-96 hours after online publication and is updated daily on week days.
Initial download of the metrics may take a while.