Fig. 5.
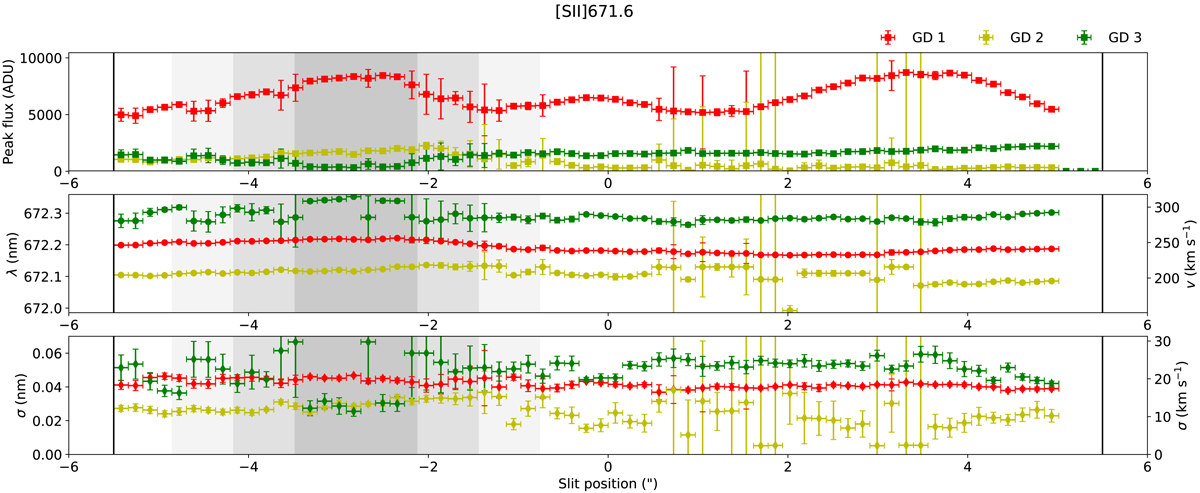
Variations in the [S II] 671.6 nm nebular line along the slit, which is modeled with a triple Gaussian model. The variations are shown for one of the nodding mode positions of S4. Top: variations in the peak flux of each GD along the slit. Middle: variations in the central wavelength or RV shift of each GD along the slit. Bottom: variations in σ of each GD along the slit. In the dark, lighter, and lightest vertical gray zones, we show the 1σ, 2σ, and 3σ seeing ranges of the object, respectively. For more information, see the text.
Current usage metrics show cumulative count of Article Views (full-text article views including HTML views, PDF and ePub downloads, according to the available data) and Abstracts Views on Vision4Press platform.
Data correspond to usage on the plateform after 2015. The current usage metrics is available 48-96 hours after online publication and is updated daily on week days.
Initial download of the metrics may take a while.