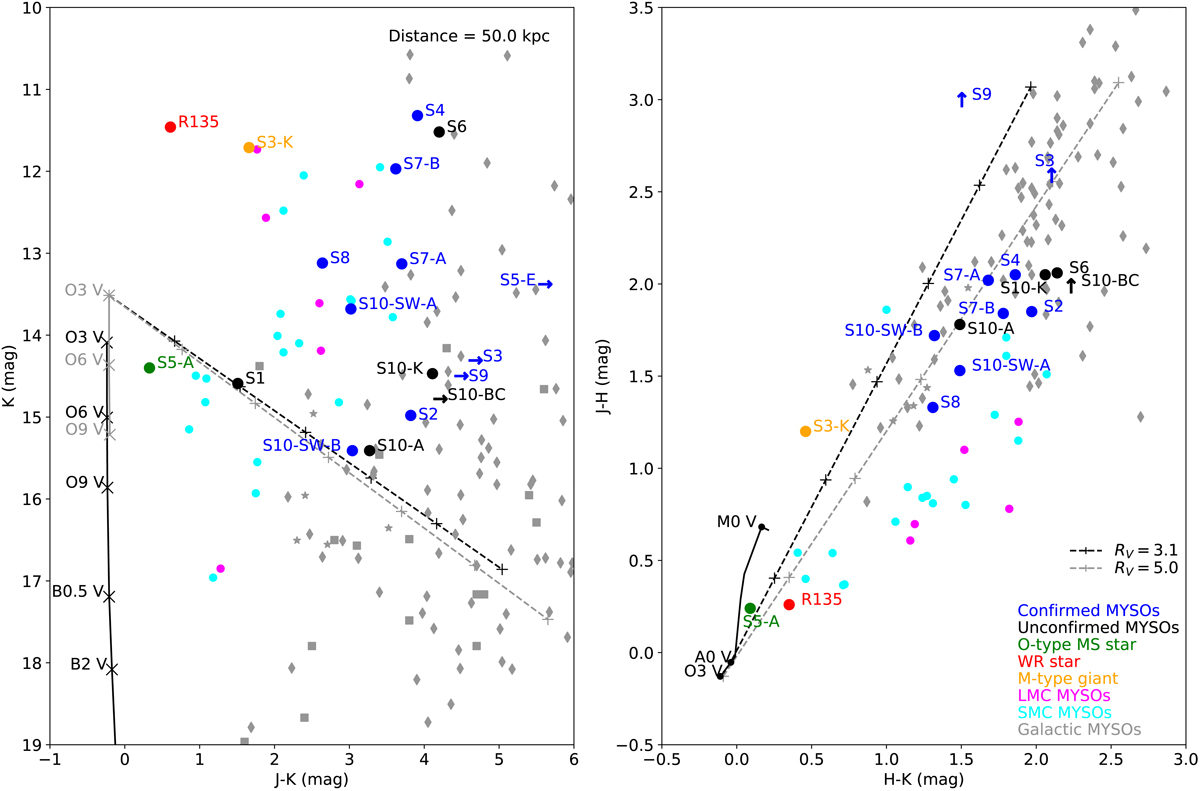
Fig. 2.

Left: NIR color-magnitude diagram of our targets. With dots, we show the objects with accurate photometry (Cutri et al. 2003; Walborn et al. 2013) and, with arrows, we show the positions of objects based on a J > 19 lower limit. Errors on the data points were omitted for clarity but are typically ∼0.05 mag. In blue, we show the MYSOs confirmed in this work and, in black, the unconfirmed MYSO candidates. The green, red, and yellow dots indicate a MS, M-type giant, and WR star, respectively. The magenta dots are other LMC MYSOs (Ward et al. 2016; Reiter et al. 2019) and the cyan dots are SMC MYSOs (Ward et al. 2017; Rubio et al. 2018). The gray stars, squares, and diamonds are the MYSOs of Ramírez-Tannus et al. (2017), Bik et al. (2006), and Cooper et al. (2013) projected at a distance of 50 kpc, respectively. The ZAMS is shown as a black line, and the gray line indicates the position of O V stars of Martins & Plez (2006). The dashed black and gray lines are the reddening lines of an O3 V star for a RV of 3.1 and 5.0, respectively, where the crosses from left to right represent a visual extinction AV of 5, 10, 15, 20, 25, and 30 mag. We note that almost all our MYSO candidates are located above the reddening lines, implying a strong NIR excess. Right: NIR color-color diagram of our targets. The colors and symbols are the same as in the left plot. Most of our targets show evidence of a NIR excess due to their position at the right of the reddening lines.
Current usage metrics show cumulative count of Article Views (full-text article views including HTML views, PDF and ePub downloads, according to the available data) and Abstracts Views on Vision4Press platform.
Data correspond to usage on the plateform after 2015. The current usage metrics is available 48-96 hours after online publication and is updated daily on week days.
Initial download of the metrics may take a while.


