Fig. 8
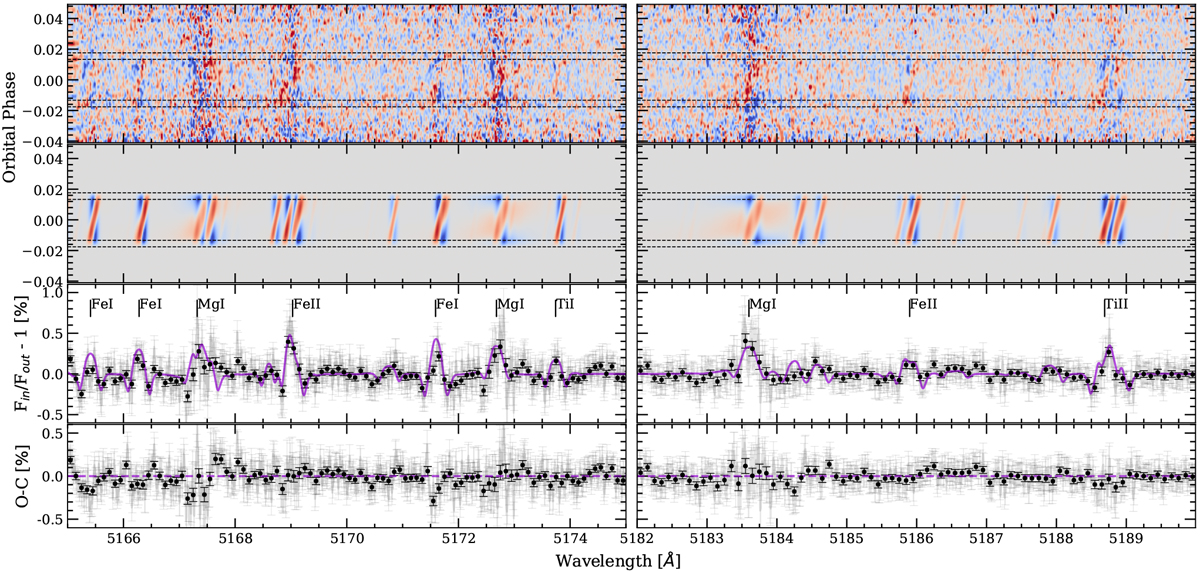
Same as Fig. 6, but in the Mg I triplet (520 nm) region, obtained with HARPS-N data. The wavelength range is divided into two panels (left and right) for better visualisation. The strongest species are indicated inside the panels. We note that in most of the cases, the effects are not only due to the species specified inside the panel, as the lines are blended. In the second row (starting from top) we additionally include the modelled effects in the stellar rest frame, so that the observed and modelled 2D maps can be easily compared.
Current usage metrics show cumulative count of Article Views (full-text article views including HTML views, PDF and ePub downloads, according to the available data) and Abstracts Views on Vision4Press platform.
Data correspond to usage on the plateform after 2015. The current usage metrics is available 48-96 hours after online publication and is updated daily on week days.
Initial download of the metrics may take a while.