Fig. 7
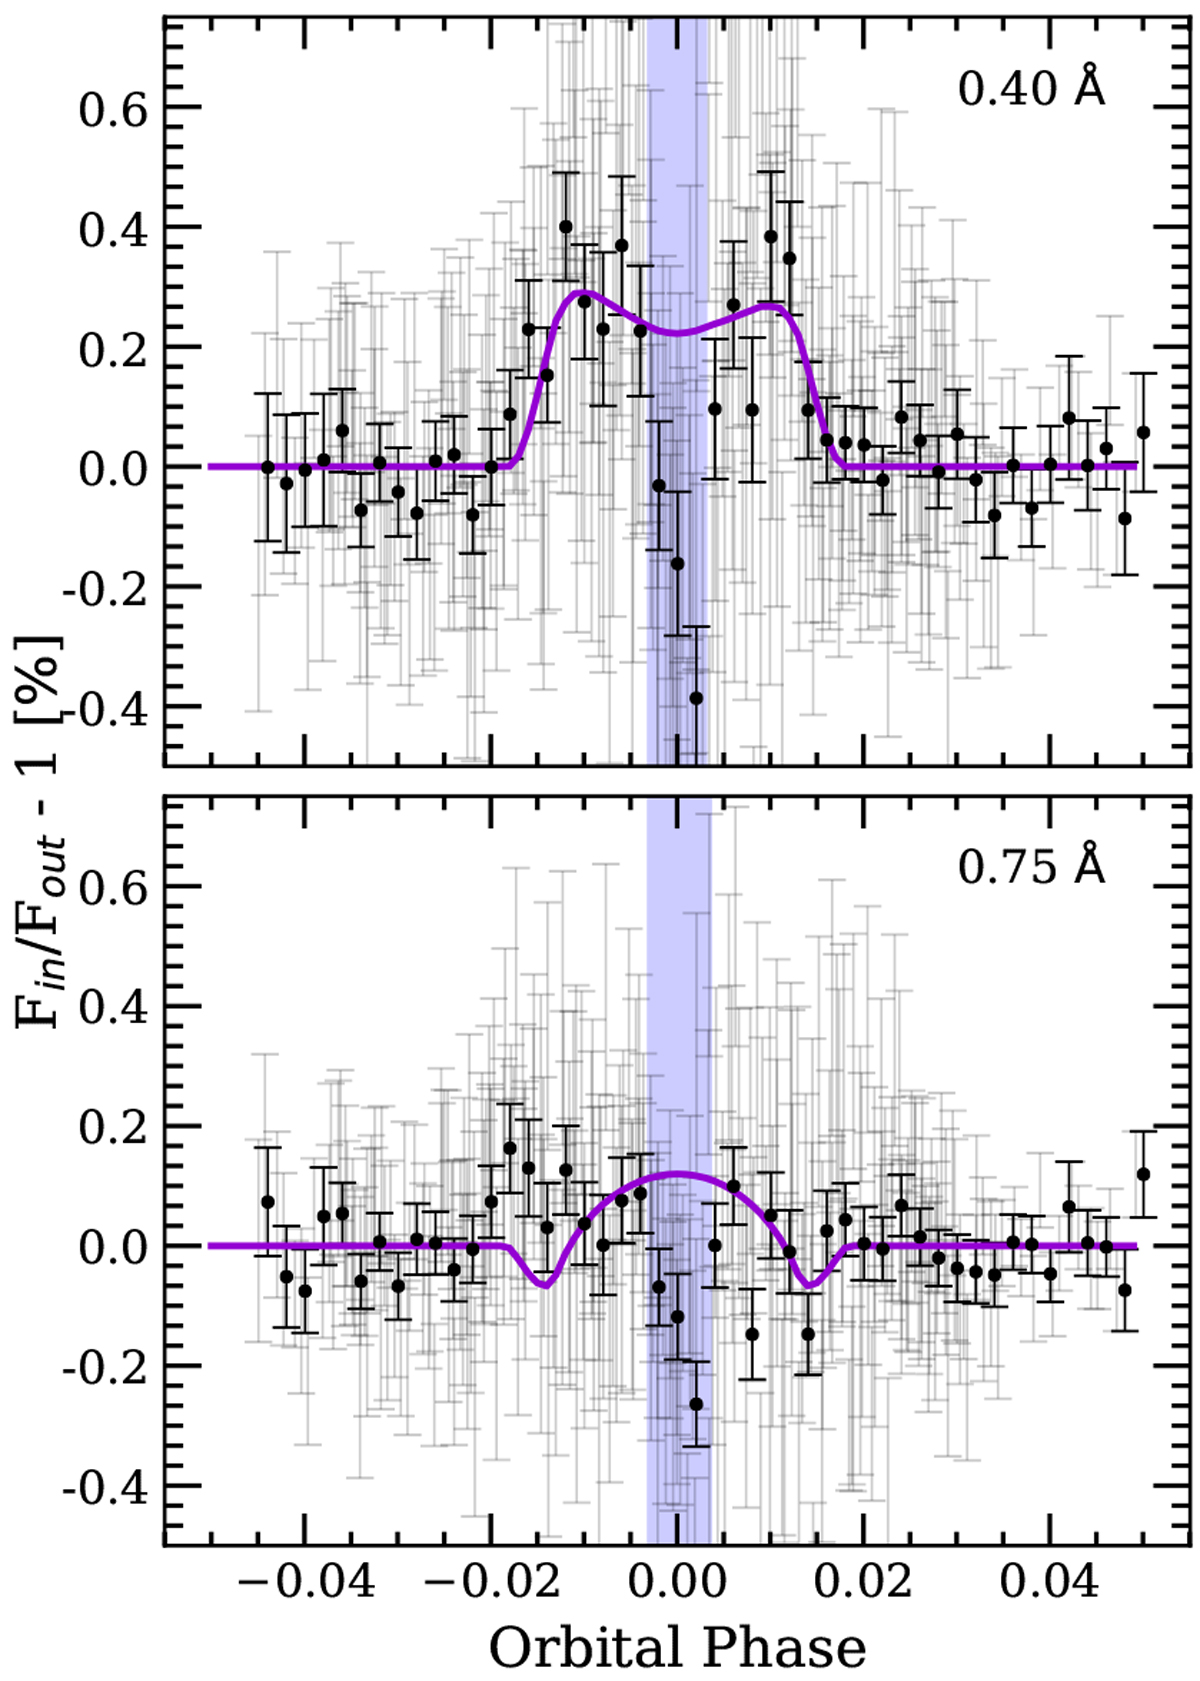
Na I observed transmission light curves calculated using the passbands of 0.40 Å (top panel) and 0.75 Å (bottom panel). In light grey we show the original data containing the combinedHARPS-N and CARMENES results. The black dots are the data binned by 0.002 in orbital phase. In purple we present the transmission light curve modelled considering the CLV and RM effects. In light blue we mark the region around zero orbital phase where the data present an unexpected behaviour.
Current usage metrics show cumulative count of Article Views (full-text article views including HTML views, PDF and ePub downloads, according to the available data) and Abstracts Views on Vision4Press platform.
Data correspond to usage on the plateform after 2015. The current usage metrics is available 48-96 hours after online publication and is updated daily on week days.
Initial download of the metrics may take a while.