Fig. 6
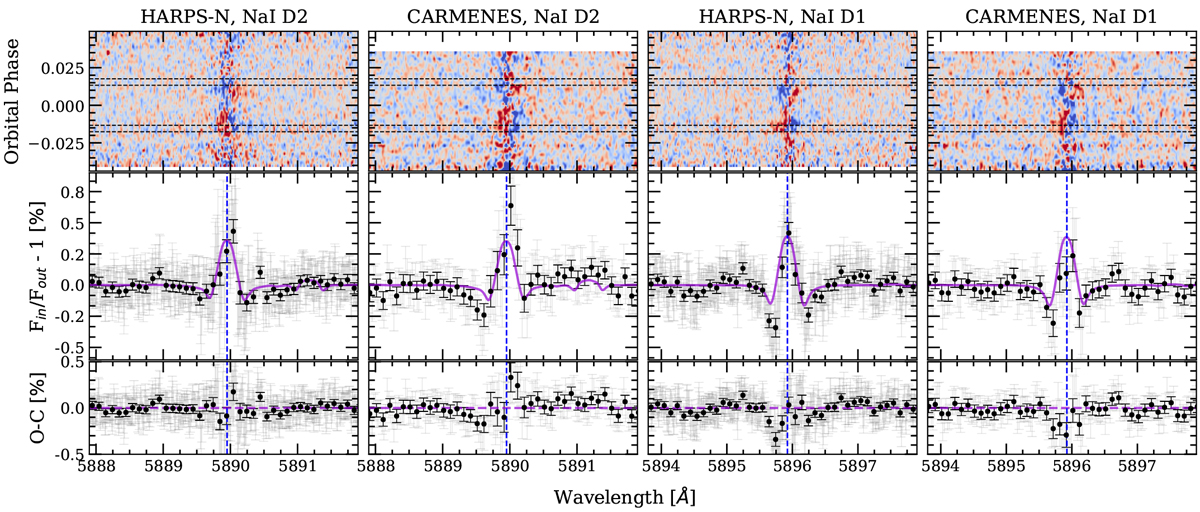
Same transmission spectra as shown in Fig. 5, but zooming into each line of the Na I doublet. The blue vertical dashed lines show the laboratory value of the Na I D2 or D1 line. In addition to the transmission spectrum of each line, we show the observed 2D maps around each particular line in the stellarrest frame. In these maps the spectra have been binned in orbital phase with a bin size of 0.002. In colour weshow the relative flux (blue and red correspond to negative and positive flux, respectively). The horizontal black dashed lines mark the four transit contacts.
Current usage metrics show cumulative count of Article Views (full-text article views including HTML views, PDF and ePub downloads, according to the available data) and Abstracts Views on Vision4Press platform.
Data correspond to usage on the plateform after 2015. The current usage metrics is available 48-96 hours after online publication and is updated daily on week days.
Initial download of the metrics may take a while.