Fig. 5
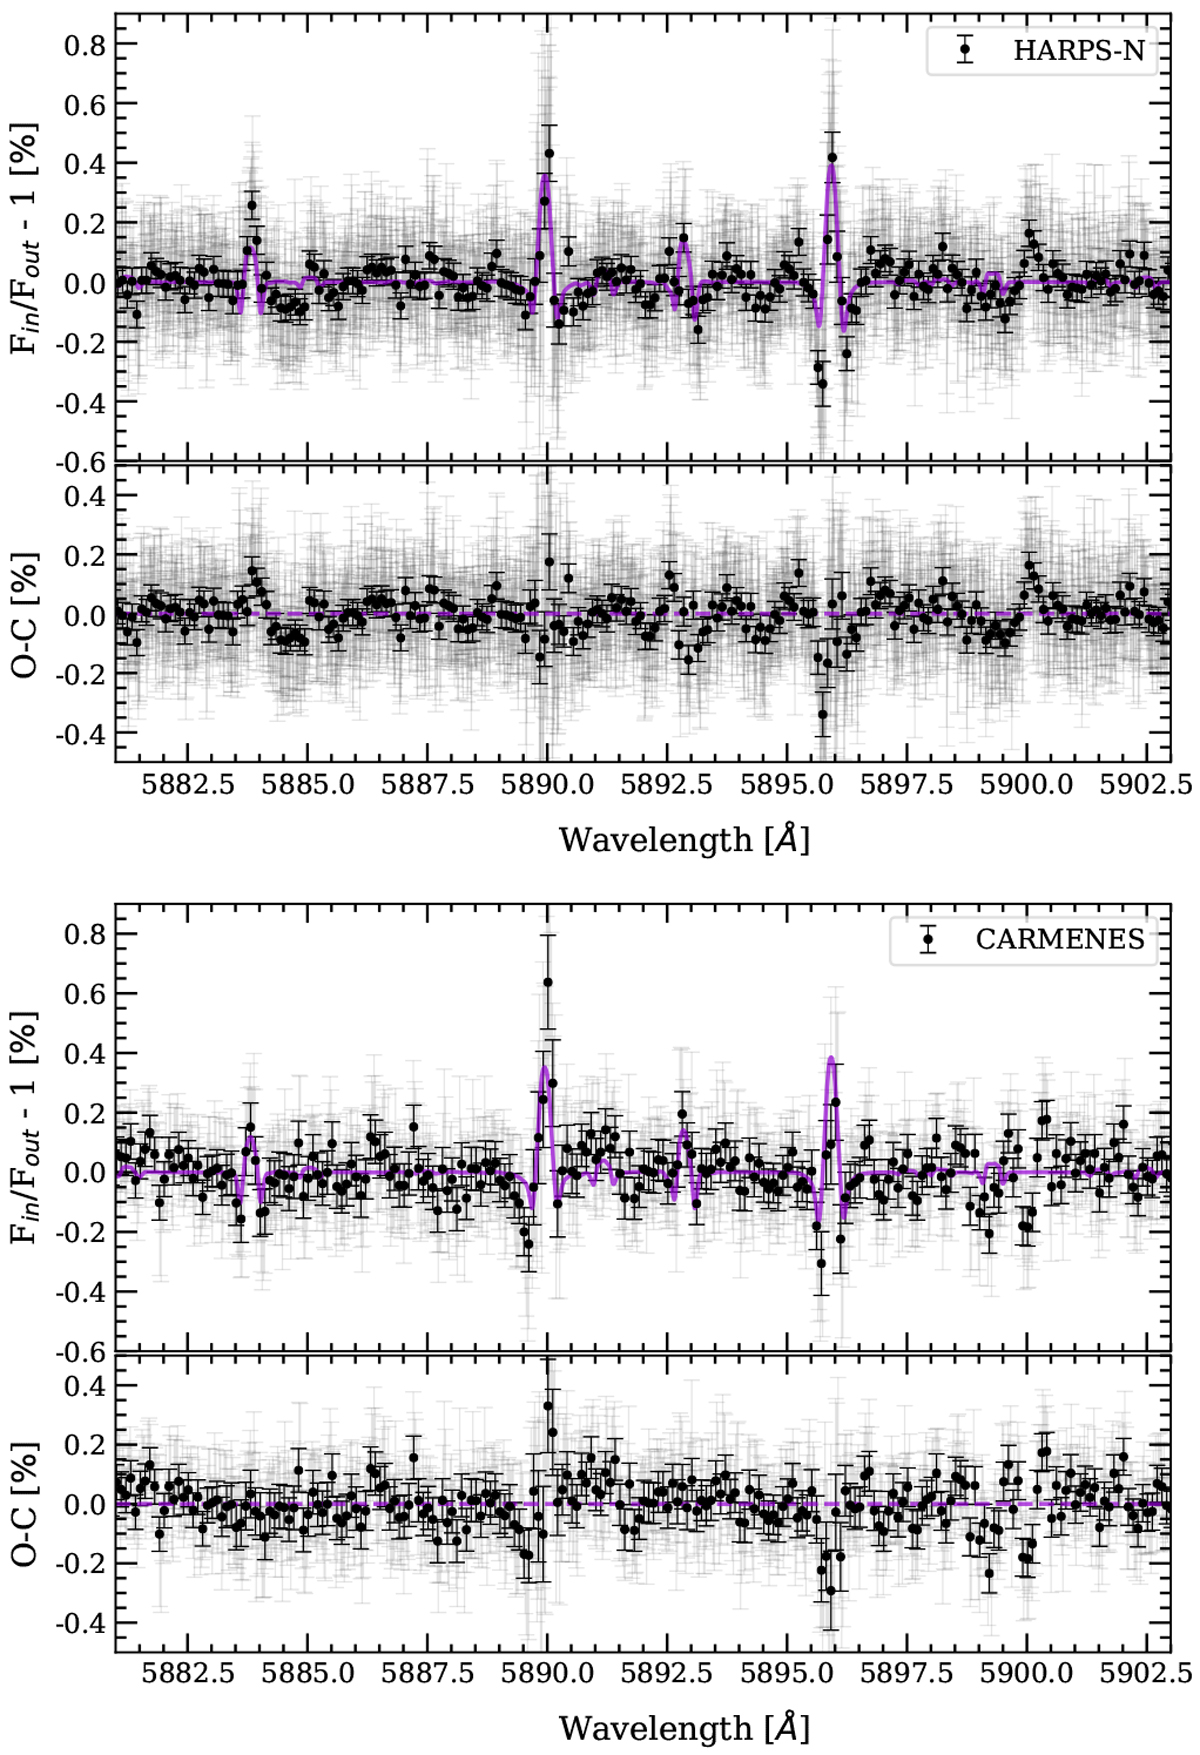
HD 209458b transmission spectrum around the Na I doublet after combining three nights observed with HARPS-N (top panel) and two with CARMENES (bottom panel). The light grey dots show the original data and the black dots the binned datausing a bin width of 0.1 Å. The purple line is the RM+CLV model. In each panel, the lower plot shows the residuals after the model is subtracted from the data.
Current usage metrics show cumulative count of Article Views (full-text article views including HTML views, PDF and ePub downloads, according to the available data) and Abstracts Views on Vision4Press platform.
Data correspond to usage on the plateform after 2015. The current usage metrics is available 48-96 hours after online publication and is updated daily on week days.
Initial download of the metrics may take a while.