Fig. 4
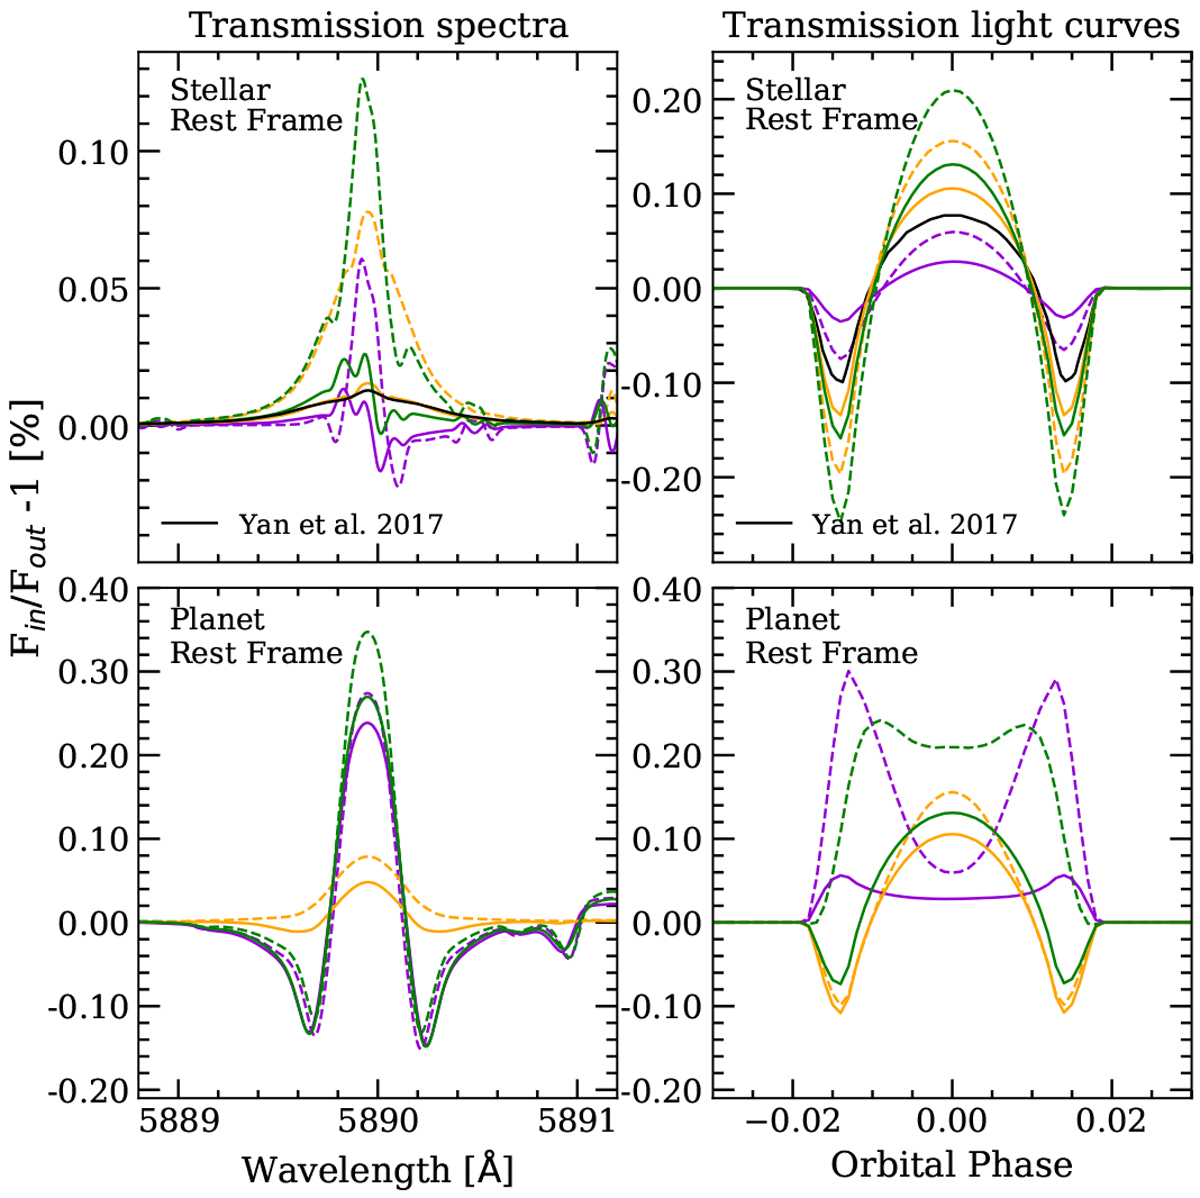
Modelled transmission spectra (left) and light curves (right) around the Na I D2 line of the system, containing only the CLV (yellow), only the RM effect (violet) and both effects together (green). In the top row we show the results computed inthe stellar rest frame, while in the bottom row they are computed in the planet rest frame. For the modelled transmission spectra, we show with solid lines the results obtained by combining the data between the first and fourth transit contacts, while the dashed lines show only the data between the second and third contacts. For the transmission light curves,the solid lines correspond to a bandwidth of 0.75 Å, and the dashed lines correspond to 0.4 Å passband. The (black) line shown in the stellar rest frame results corresponds to the models presented in Yan et al. (2017), which considered non-LTE effects in the stellar models calculation and measured the light curves using a different method.
Current usage metrics show cumulative count of Article Views (full-text article views including HTML views, PDF and ePub downloads, according to the available data) and Abstracts Views on Vision4Press platform.
Data correspond to usage on the plateform after 2015. The current usage metrics is available 48-96 hours after online publication and is updated daily on week days.
Initial download of the metrics may take a while.