Fig. 3
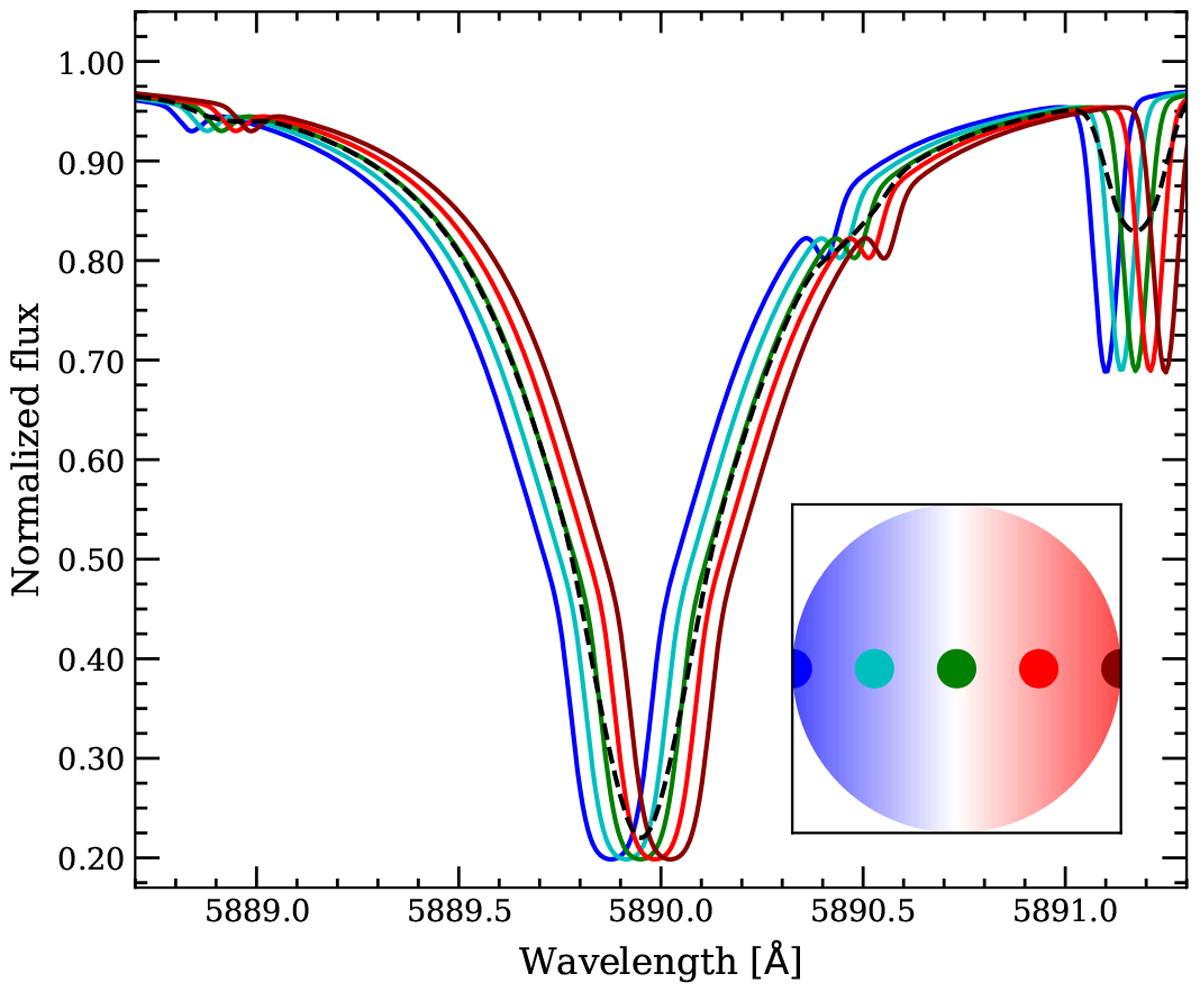
Modelled stellar spectra around the Na I D2 line of HD 209458 system, containing only the RM effect. The black dashed line shows the out-of-transit spectrum (integrated stellar disc). The coloured lines show the spectra of the regions that are blocked by the planet at five different orbital phases, which are then subtracted from the integrated stellar disc spectrum to compute the final stellar models. We note that these spectra are all normalised by their own continuum level for a better comparison of the line profile. However, in the real subtraction the blocked spectra represent only a small part of the light received from the stellar disc. The approximate position of the planet in each calculation (colours) is indicated in the subplot located in the bottom right corner of the main figure.
Current usage metrics show cumulative count of Article Views (full-text article views including HTML views, PDF and ePub downloads, according to the available data) and Abstracts Views on Vision4Press platform.
Data correspond to usage on the plateform after 2015. The current usage metrics is available 48-96 hours after online publication and is updated daily on week days.
Initial download of the metrics may take a while.