Fig. C.1
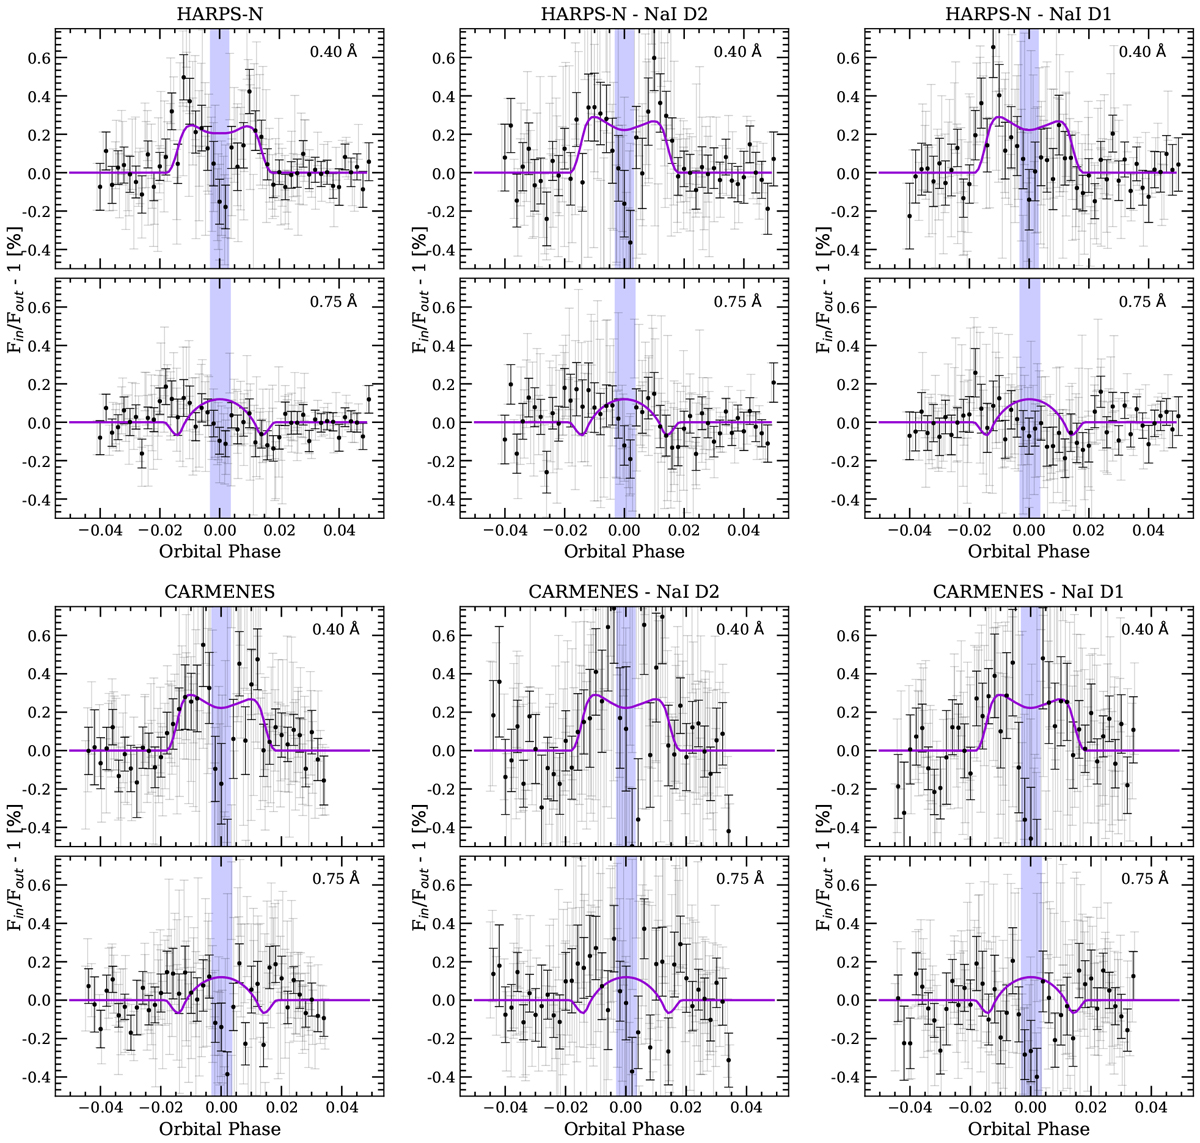
Observed transmission light curves for the Na I doublet computed using HARPS-N (top row panels) and CARMENES (bottom row panels) data sets. In each panel we show the light curves for two different passbands: 0.4 Å (top row) and 0.75 Å (bottom row). Each column corresponds to a different computation: the Na I D2 and D1 lines combined (left column), only Na I D2 (middle column), and only Na I D1 (right column). In all cases, the light grey data correspond to the original data, while the black dots are the data binned by 0.002 in orbital phase. In purple we show the modelled light curves containing the CLV and RM effects.
Current usage metrics show cumulative count of Article Views (full-text article views including HTML views, PDF and ePub downloads, according to the available data) and Abstracts Views on Vision4Press platform.
Data correspond to usage on the plateform after 2015. The current usage metrics is available 48-96 hours after online publication and is updated daily on week days.
Initial download of the metrics may take a while.