Free Access
Fig. B.1
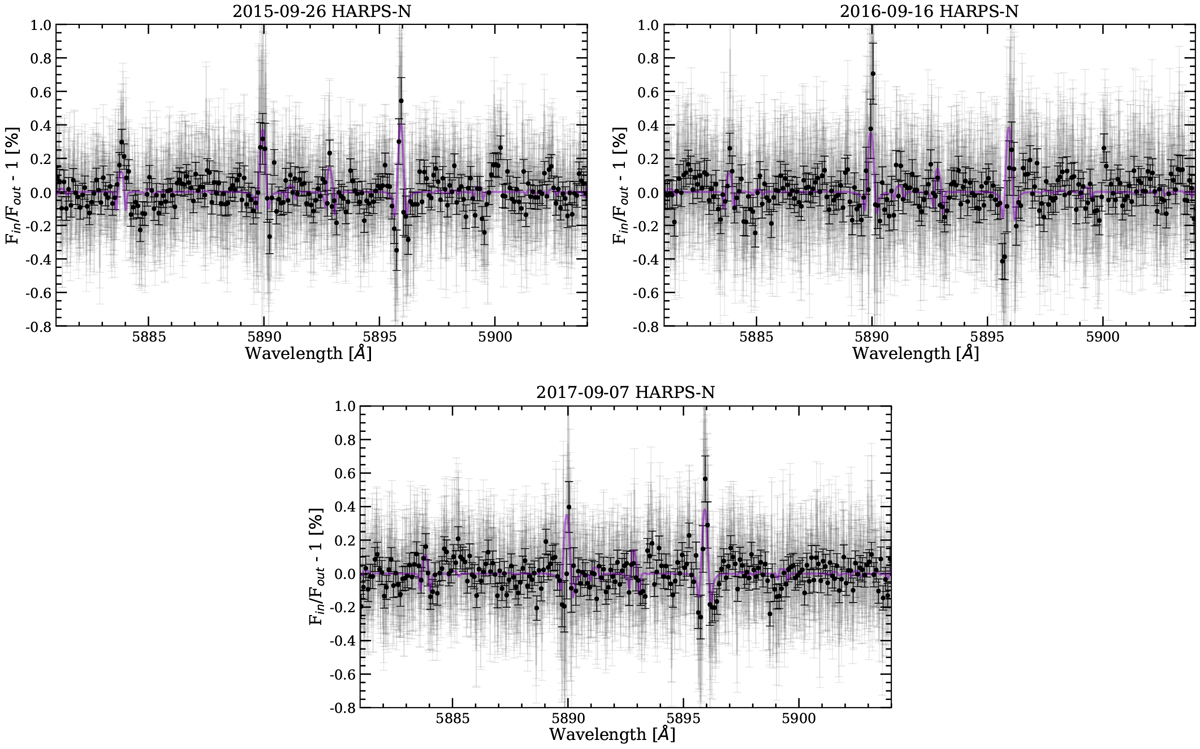
HD 209458b transmission spectra around the Na I doublet for three different HARPS-N data sets. In light grey we show theoriginal data, and as black dots the data binned by 0.1 Å. In purple we show the RME+CLV model for each data set.
Current usage metrics show cumulative count of Article Views (full-text article views including HTML views, PDF and ePub downloads, according to the available data) and Abstracts Views on Vision4Press platform.
Data correspond to usage on the plateform after 2015. The current usage metrics is available 48-96 hours after online publication and is updated daily on week days.
Initial download of the metrics may take a while.