Fig. 1
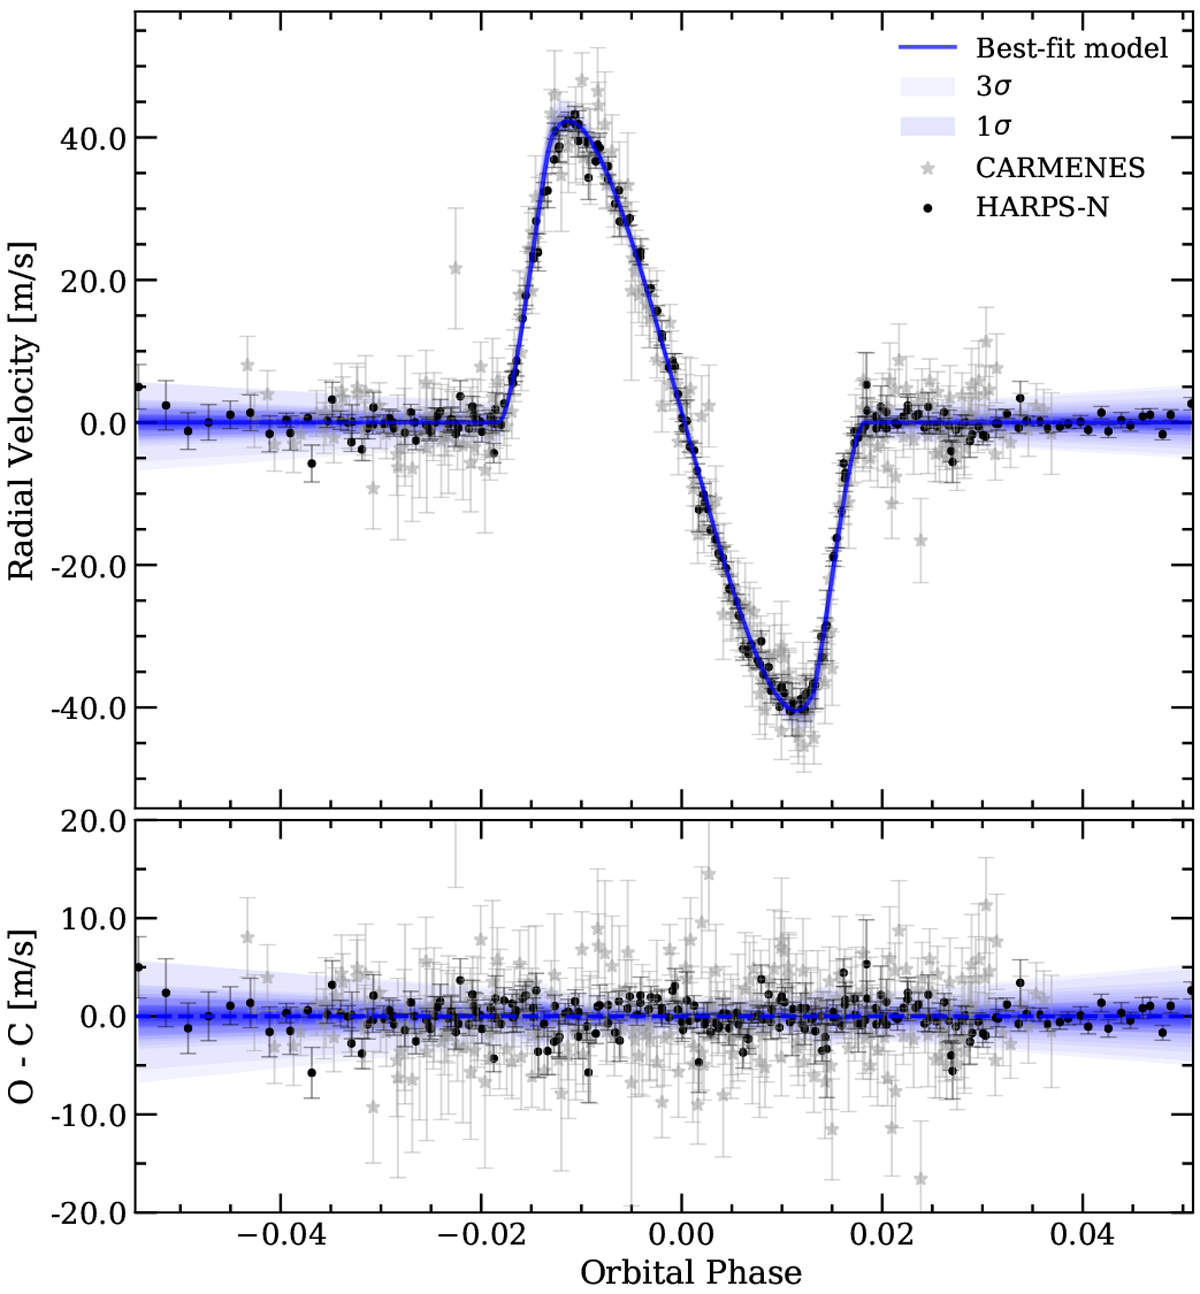
Radial velocity anomaly due to the RM effect (top panel) and residuals between the data and model (bottom panel). The detrended stellar radial velocity values observed with CARMENES (four transits) are presented as grey stars. HARPS-N data sets (five transits) are presented as black dots. The blue line shows the model resulting from the combination of the HARPS-N and CARMENES best-fit models. In light blue we present the 1σ and 3σ uncertainties of the model.
Current usage metrics show cumulative count of Article Views (full-text article views including HTML views, PDF and ePub downloads, according to the available data) and Abstracts Views on Vision4Press platform.
Data correspond to usage on the plateform after 2015. The current usage metrics is available 48-96 hours after online publication and is updated daily on week days.
Initial download of the metrics may take a while.