Free Access
Fig. 9.
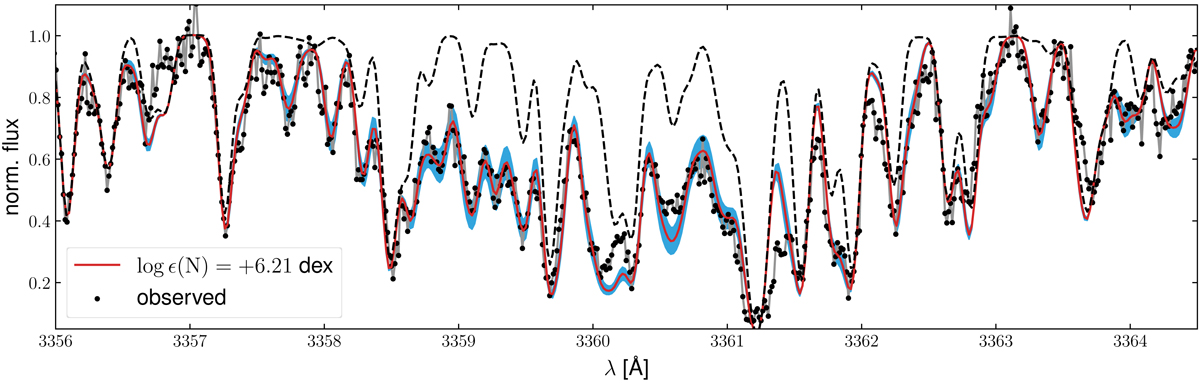
Same as right panel of Fig. 7, but for a synthesis of the NH-band at ∼3360 Å. A synthesis without any N is indicated by the black dashed curve. The blue error range corresponds to an abundance variation of ±0.10 dex.
Current usage metrics show cumulative count of Article Views (full-text article views including HTML views, PDF and ePub downloads, according to the available data) and Abstracts Views on Vision4Press platform.
Data correspond to usage on the plateform after 2015. The current usage metrics is available 48-96 hours after online publication and is updated daily on week days.
Initial download of the metrics may take a while.