Fig. 7.
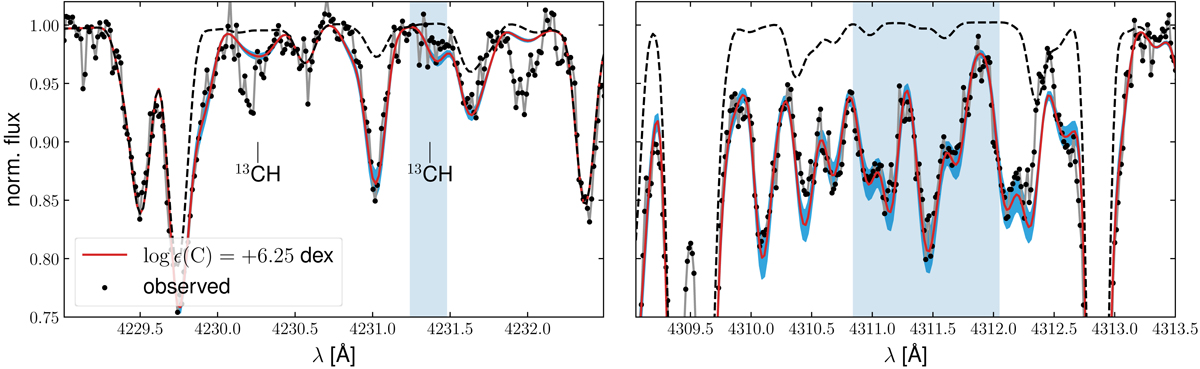
C abundance and 12C/13C from the CH G-band in the UVES 390 spectrum. Left panel: region around the two features that are dominated by 13CH, one of which is used to pinpoint 12C/13C (blue rectangle). The bluer feature at ∼4230 Å was not considered due to an unidentified blend (see main text). The observed spectrum is represented by black dots connected by gray lines and the best-fit synthesis (red) and its abundance error margin of 0.05 dex are depicted in blue, respectively. The dashed spectrum shows a synthesis without any C. Right panel: same as left panel but in the range used to constrain the C (CH) abundance.
Current usage metrics show cumulative count of Article Views (full-text article views including HTML views, PDF and ePub downloads, according to the available data) and Abstracts Views on Vision4Press platform.
Data correspond to usage on the plateform after 2015. The current usage metrics is available 48-96 hours after online publication and is updated daily on week days.
Initial download of the metrics may take a while.