Fig. 5.
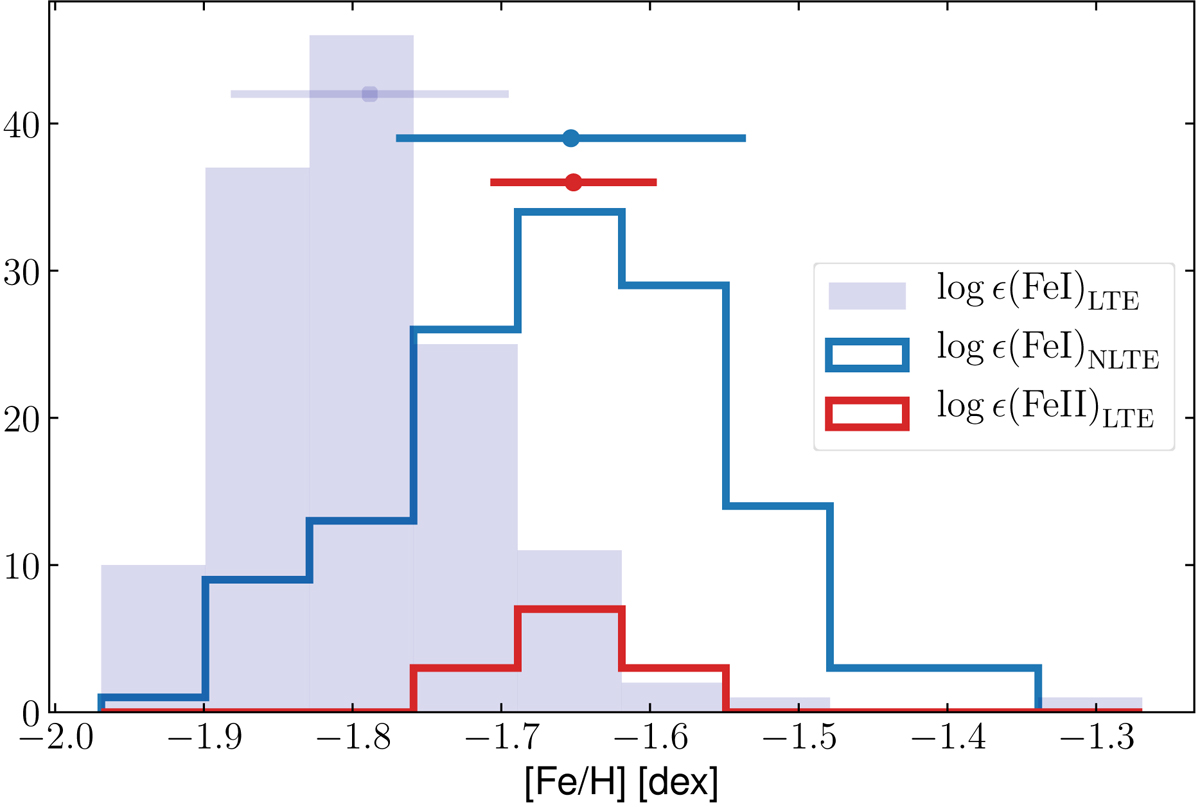
Diagnostic plot for spectroscopic ionization balance. Shown are the histograms of the Fe abundance distributions ([Fe/H] = log ϵ(Fe) − 7.50 dex) at the adopted gravity (log g = 2.24 dex from method M2, see Sect. 3.4) both in LTE (gray filled) and NLTE (blue) for Fe I and in LTE for Fe II (red). NLTE corrections for Fe II remain well below 0.01 dex and are therefore neglected here. Points with error bars and arbitrary ordinate offsets at the top of the panel denote the means and standard deviations for each of the distributions of the same color.
Current usage metrics show cumulative count of Article Views (full-text article views including HTML views, PDF and ePub downloads, according to the available data) and Abstracts Views on Vision4Press platform.
Data correspond to usage on the plateform after 2015. The current usage metrics is available 48-96 hours after online publication and is updated daily on week days.
Initial download of the metrics may take a while.