Fig. 4.
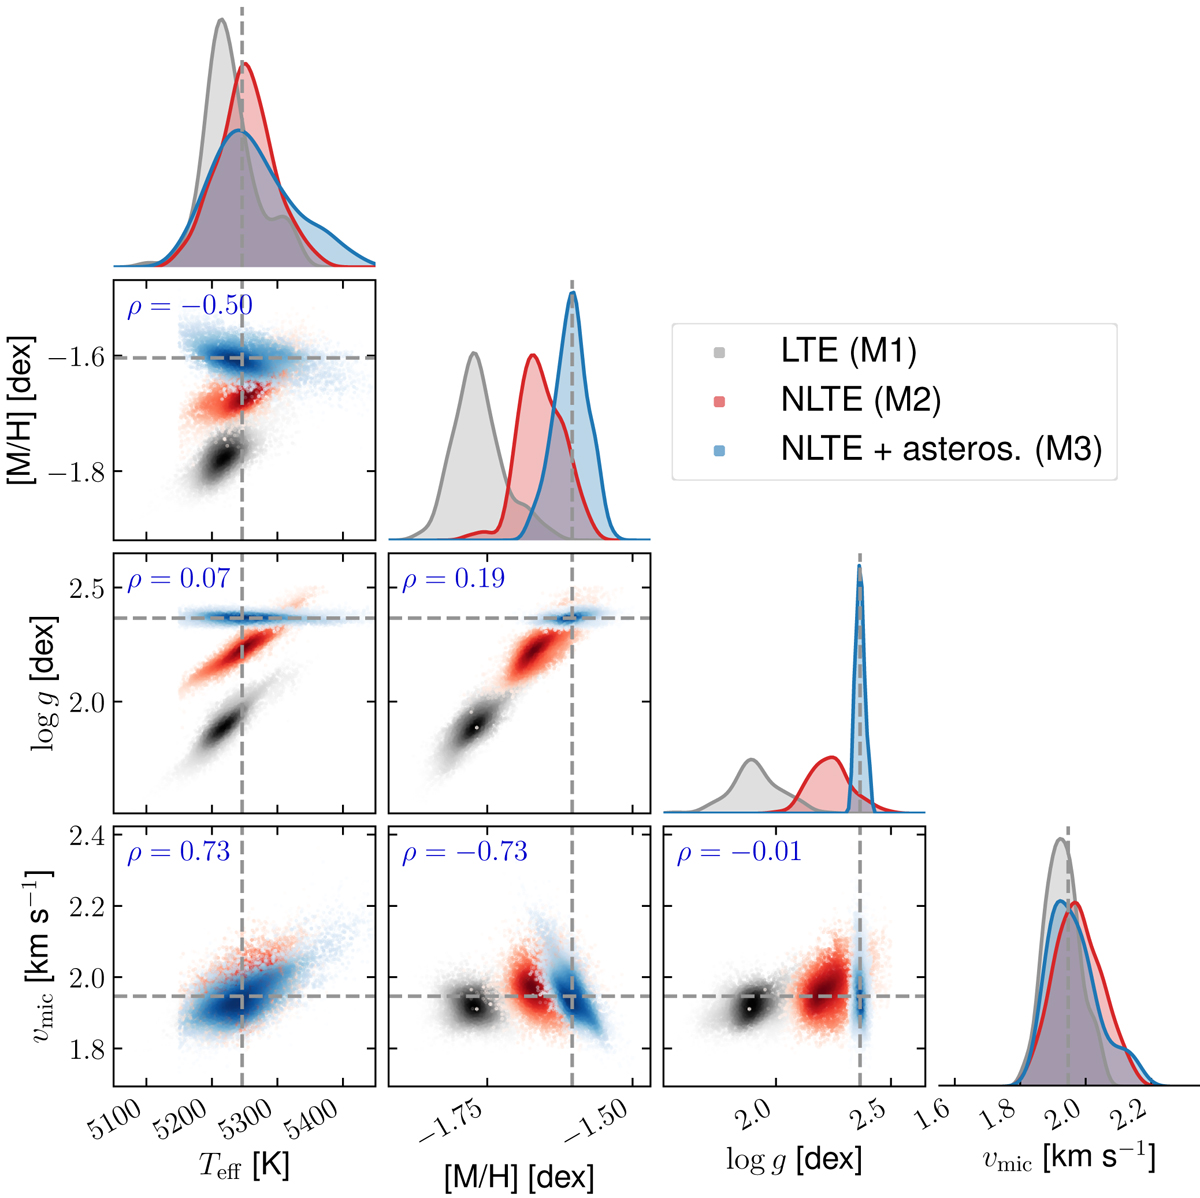
Samples drawn from the posterior distribution of the stellar parameters (Eq. (2)). Shown are the three different approaches M1 (gray), M2 (red), and M3 (blue) with the darkness of the colors illustrating the local density as estimated from a Gaussian kernel density estimate. The sample sizes are 2 × 10⁴ and the adopted stellar parameters from method M3 (Tables 2 and 3) based on the median of the distributions are indicated using horizontal and vertical dashed lines. The correlation coefficients for pairs of two parameters in M3 are presented in the top left corner of each panel. The marginalized, one-dimensional distributions for the individual parameters are depicted by smoothed histograms at the top of each column.
Current usage metrics show cumulative count of Article Views (full-text article views including HTML views, PDF and ePub downloads, according to the available data) and Abstracts Views on Vision4Press platform.
Data correspond to usage on the plateform after 2015. The current usage metrics is available 48-96 hours after online publication and is updated daily on week days.
Initial download of the metrics may take a while.