Fig. A.2.
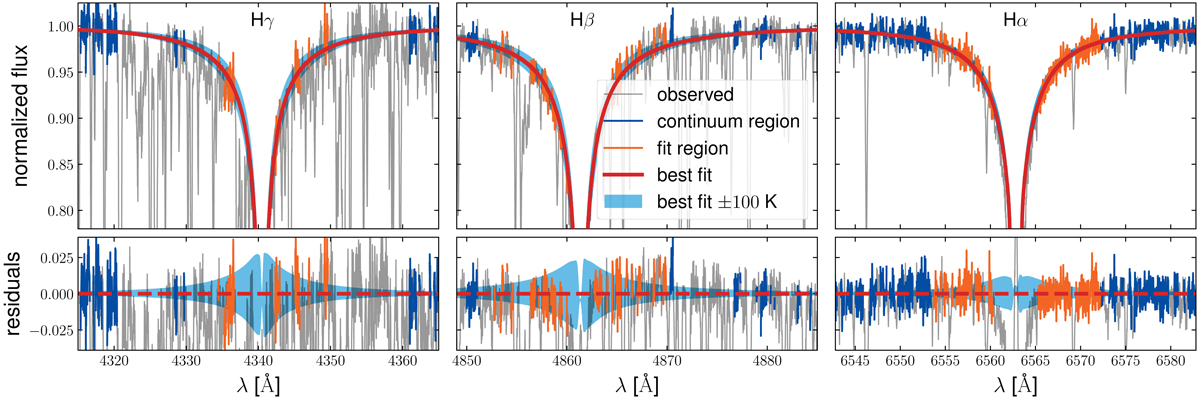
Teff fit results from fitting the wings of the Balmer lines Hγ (left), Hβ (middle), and Hα (right). Upper panels: observed spectra (gray) with the best-fit 3D NLTE models (5260/5260/5360 K) by Amarsi et al. (2018) and their error margins of 100 K depicted by red lines and blue areas, respectively. The wavelength regions used to obtain the continuum level are marked in blue, whereas orange lines highlight the parts of the spectrum that entered the χ2 minimization. Lower panels: residual spectrum.
Current usage metrics show cumulative count of Article Views (full-text article views including HTML views, PDF and ePub downloads, according to the available data) and Abstracts Views on Vision4Press platform.
Data correspond to usage on the plateform after 2015. The current usage metrics is available 48-96 hours after online publication and is updated daily on week days.
Initial download of the metrics may take a while.