Fig. 19.
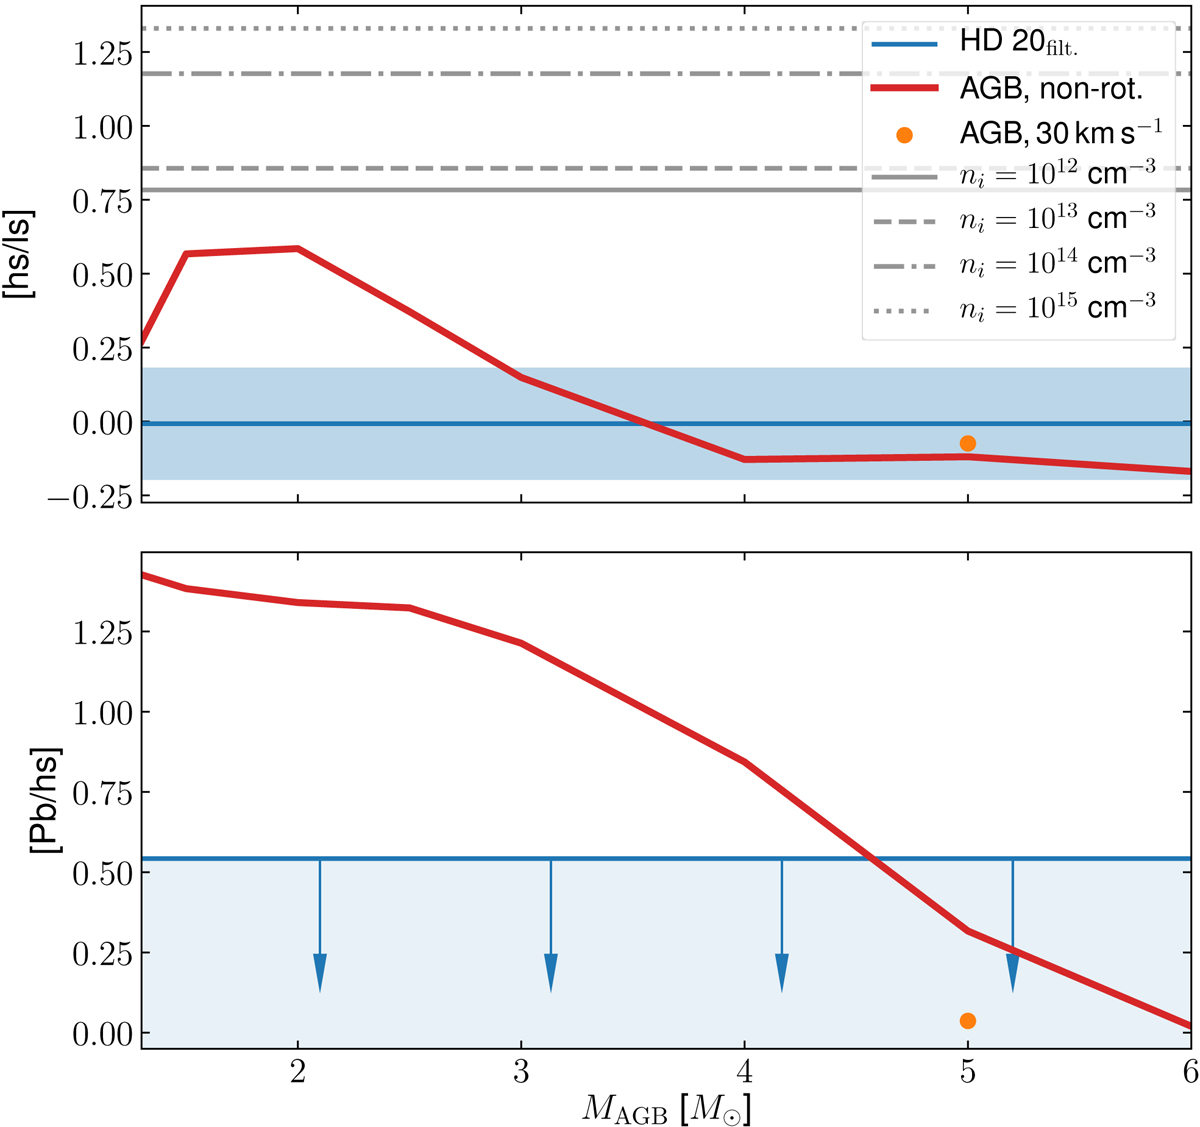
Comparison of [hs/ls] and upper limit on [Pb/hs] for HD 20 against AGB s-process models of different initial masses. The value determined for HD 20 is indicated by blue horizontal lines and error margins, while models of Z = 0.0001 without rotation are shown in red. The adopted best-fit model with a rotation of 30 km s−1 is depicted in orange. For juxtaposition, we show i-process predictions for [hs/ls] from Hampel et al. (2016) for four different neutron densities, ni, in the upper panel using black dotted, dash-dotted, dashed, and solid lines (see legend).
Current usage metrics show cumulative count of Article Views (full-text article views including HTML views, PDF and ePub downloads, according to the available data) and Abstracts Views on Vision4Press platform.
Data correspond to usage on the plateform after 2015. The current usage metrics is available 48-96 hours after online publication and is updated daily on week days.
Initial download of the metrics may take a while.