Fig. 18.
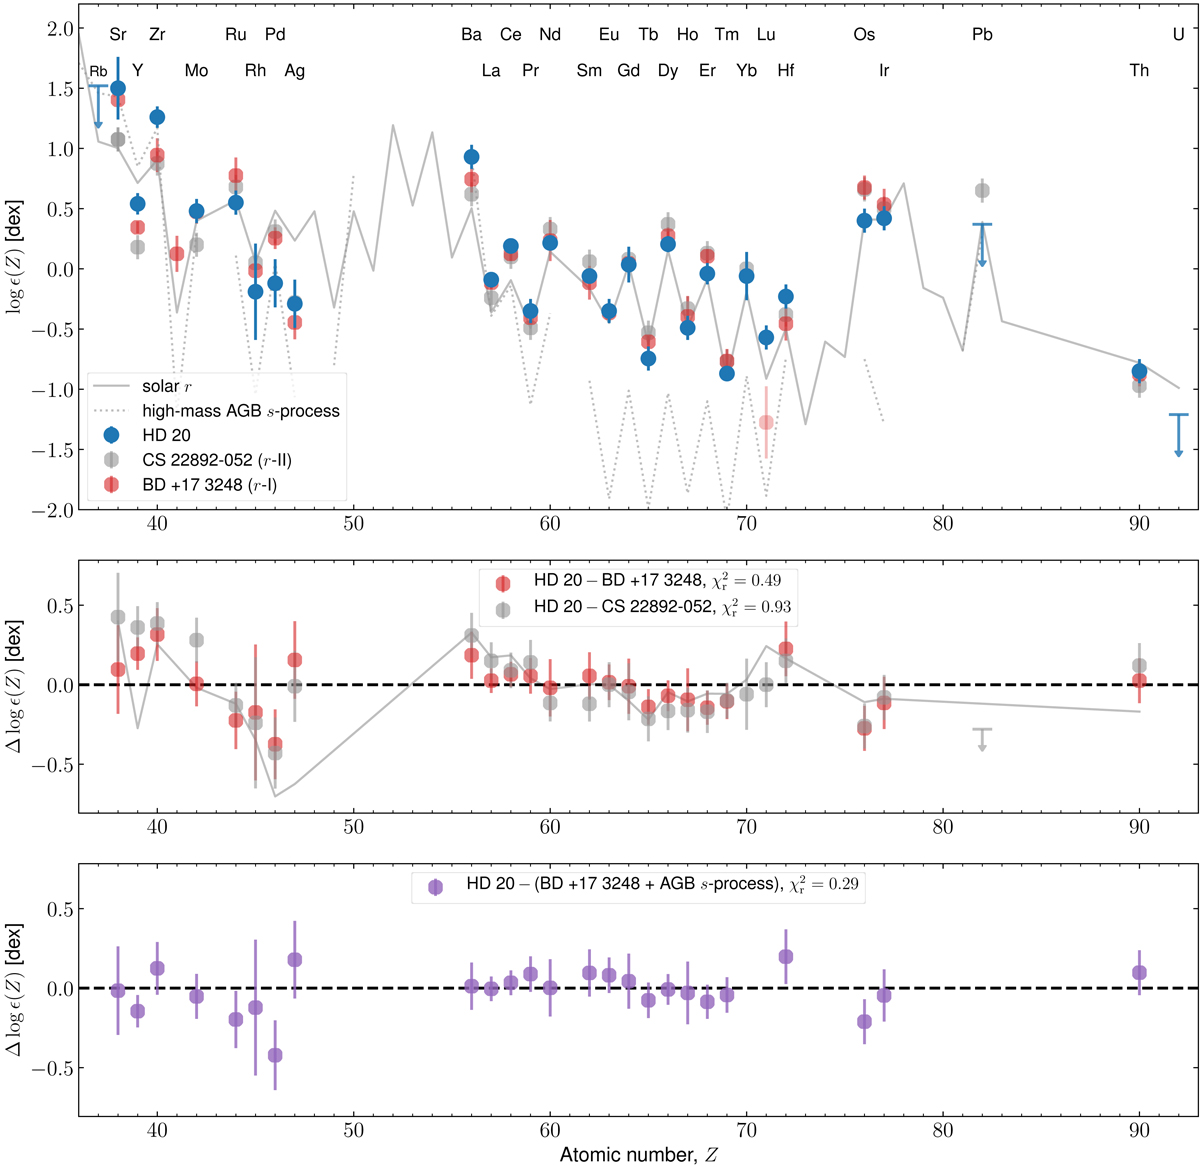
Neutron-capture abundance pattern in LTE. Upper panel: HD 20’s heavy element abundances are indicated in blue. Shown in gray and red are abundances of the r-II star CS 22892−052 by Sneden et al. (2003) and the r-I star BD +17 3248 by Cowan et al. (2002) with updates from Cowan et al. (2005) and Roederer et al. (2010). The omitted Lu abundance for BD +17 3248 (see main text) is depicted in light red. Both patterns were scaled to achieve the overall best match to HD 20 in the entire considered range. The gray solid line denotes the solar-scaled r pattern from Sneden et al. (2008) and the best-fit AGB model (see text) is represented by dotted lines. Middle panel: residual pattern between HD 20 and the solar r pattern (gray line), CS 22892−052 (gray), and BD +17 3248 (red). Lower panel: residual pattern after mixing a contribution from BD +17 3248 with s-process material from the AGB yield model.
Current usage metrics show cumulative count of Article Views (full-text article views including HTML views, PDF and ePub downloads, according to the available data) and Abstracts Views on Vision4Press platform.
Data correspond to usage on the plateform after 2015. The current usage metrics is available 48-96 hours after online publication and is updated daily on week days.
Initial download of the metrics may take a while.