Fig. 10.
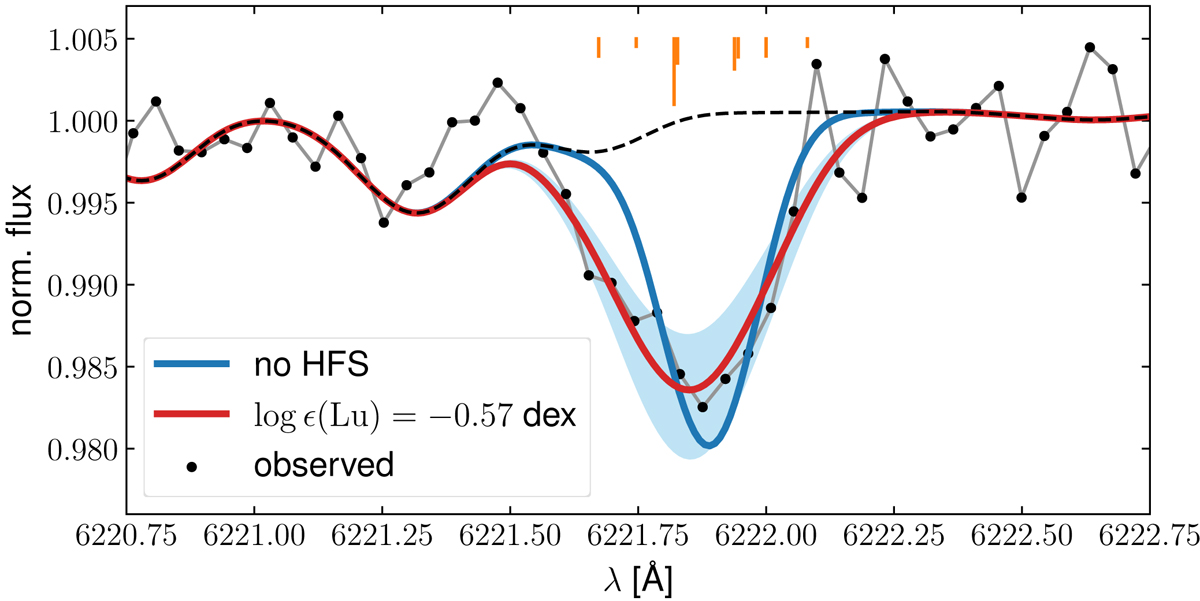
Synthesis of the Lu II line at 6221.9 Å. The red line represents the best abundance match with an error of 0.1 dex (blue shaded region). The broad range of HFS components for 175Lu from Lawler et al. (2009) are indicated by vertical orange lines at the top and have been taken into account for this synthesis. The impact of the negligence of HFS on the line shape is indicated by the blue line.
Current usage metrics show cumulative count of Article Views (full-text article views including HTML views, PDF and ePub downloads, according to the available data) and Abstracts Views on Vision4Press platform.
Data correspond to usage on the plateform after 2015. The current usage metrics is available 48-96 hours after online publication and is updated daily on week days.
Initial download of the metrics may take a while.