| Issue |
A&A
Volume 635, March 2020
|
|
|---|---|---|
| Article Number | A25 | |
| Number of page(s) | 10 | |
| Section | Astrophysical processes | |
| DOI | https://doi.org/10.1051/0004-6361/201936715 | |
| Published online | 02 March 2020 | |
Investigation of the γ-ray spectrum of CTA 102 during the exceptional flaring state in 2016–2017
1
ICRANet-Armenia, Marshall Baghramian Avenue 24a, Yerevan, 0019, Armenia
2
ICRANet, P.zza della Repubblica 10, 65122 Pescara, Italy
e-mail: This email address is being protected from spambots. You need JavaScript enabled to view it.
Received:
17
September
2019
Accepted:
27
November
2019
Abstract
The flat spectrum radio quasar CTA 102 entered an extended period of activity from 2016 to 2017 during which several strong γ-ray flares were observed. By using Fermi large area telescope data, a detailed investigation of γ-ray spectra of CTA 102 during the flaring period was performed. In several periods, the γ-ray spectrum is not consistent with a simple power-law, having a hard photon index with an index of ∼(1.8−2.0) that shows a spectral cut-off around an observed photon energy of ∼(9−16) GeV. The internal γ-ray absorption via photon-photon pair production on the broad-line-region-reflected photons cannot account for the observed cut-off and break even if the emitting region is very close to the central source. This cut-off and break are likely due to a similar intrinsic break in the energy distribution of emitting particles. The origin of the spectral break is investigated through the multiwavelength modeling of the spectral energy distribution in considering a different location for the emitting region. The observed X-ray and γ-ray data is modeled as inverse Compton scattering of synchrotron and/or external photons on the electron population that produces the radio-to-optical emission, which allowed to constrain the power-law index and cut-off energy in the electron energy distribution. The obtained results are discussed in the context of a diffusive acceleration of electrons in the CTA 102 jet.
Key words: quasars: individual: CTA 102 / radiation mechanisms: non-thermal / gamma-rays: galaxies / galaxies: jets
© ESO 2020
1. Introduction
Jets are observed in many classes of astrophysical objects, ranging from active galactic nuclei (AGNs) to galactic binary systems (e.g., de Gouveia Dal Pino 2005; Beall 2017). The jets are most likely powered by accretion processes, which are among the most powerful emitters of radiation in the Universe. Undoubtedly, AGNs are one of the most representative classes of astrophysical objects where the jets can be studied in all scales. The jets in these objects are the manifestation of energy release from super-massive black holes (with masses up to 109 M⊙) and they can extend to several hundreds of kiloparsecs and in some cases to a few megaparsecs into the space that oftentimes remains highly collimated. Currently, the emission from these jets can be observed not only from their innermost regions, where it is stronger, but also from extended components. For example, the emission up to the X-ray band from the extended knots or hot spots of relativistic jets is observed (e.g., Harris & Krawczynski 2002; Stawarz et al. 2004; Kataoka & Stawarz 2005), the origin of the emission is explained either by synchrotron emission (Harris & Krawczynski 2006) or by the inverse Compton (IC) scattering of either synchrotron photons (Hardcastle et al. 2002) or cosmic microwave background (CMB) photons (Tavecchio et al. 2000; Celotti et al. 2001; Zargaryan et al. 2017). However, in some cases, the IC/CMB model has been ruled out (see Meyer & Georganopoulos 2014; Meyer et al. 2015, 2017; Breiding et al. 2017). Several alternative emission models for the knots involve the radiation of protons (e.g., Bhattacharyya & Gupta 2016; Kusunose & Takahara 2017; Aharonian 2002). Even though the observations of knots, hot-spots, and lobes provide significant information about jet energetics and dynamics, it is necessary to carry out extensive studies of their initial sub-parsec-scale region in order to understand the central source as well as the formation and propagation of the jets.
The observation of blazars is the best way to explore the physics of jets. Blazars are a subclass of AGNs with a dominant nonthermal emission from a jet that is closely aligned with the observer’s line of sight (Urry & Padovani 1995). Such a geometry leads to the relativistic Doppler amplification of the emission and the radiation appears brighter for the observer. Consequently, the blazars are observed even at very high redshifts (e.g., Ackermann et al. 2017). Blazars are the most luminous and energetic objects in the known Universe and they are the dominant sources in the extragalactic γ-ray sky. In the high-energy (HE; >100 MeV) γ-ray band, out of the 5000sources detected to date, more than 3100 sources are blazars (The Fermi-LAT Collaboration 2019). One of the most distinct features of blazars is rapid variability across the whole electromagnetic spectrum with the most dramatic and short time scale changes being observed in the γ-ray band (e.g., minute scales, Ackermann et al. 2016; Foschini et al. 2011, 2013; Nalewajko 2013; Brown 2013; Rani et al. 2013; Saito et al. 2013; Hayashida et al. 2015). This strongly constrains the emitting region size (by the light travel considerations), suggesting that radiation comes from a compact region of the jet. Traditionally, the blazars are classified based on their emission lines: flat-spectrum radio quasars (FSRQs) exhibit broad emission lines, while BL Lacs show weak or no emission lines in their optical spectra. A different classification is based on the synchrotron peak frequency (νp): when νp is in the infrared, optical, or ultraviolet and X-ray bands, sources are classified in the low synchrotron peak (LSP), intermediate synchrotron peak (ISP), and high synchrotron peak (HSP), respectively (Padovani & Giommi 1995; Abdo et al. 2010a). Typically FSRQs are LSP and ISP blazars, whereas, BL Lacs are mostly HSP ones.
The broadband spectral energy distribution (SED) of blazars exhibits a double-peaked structure in which one component is between the infrared and X-ray bands (low-energy component) and the other component is above the X-ray band (HE component). It is well established that the low-energy component is from the synchrotron emission of electrons in the magnetic field of the jet, but the nature of HE component is not understood as well. The HE component is most likely due to the IC up-scattering of the low energy photons produced either inside, which is referred to as synchrotron self Compton (SSC), (Ghisellini et al. 1985; Bloom & Marscher 1996; Maraschi et al. 1992) or outside of the jet, known as external inverse Compton (EIC; Błażejowski et al. 2000; Ghisellini & Tavecchio 2009; Sikora et al. 1994). The nature of the external photon field depends on the location of the emitting region and can be either the photons directly emitted from the disk, those reflected from the broad line region (BLR), infrared photons emitted from the dusty torus, or photons from dusty torus clouds irradiated by a spine-sheath jet when the emission region is further (>pc) from the central objects (Breiding et al. 2018). The SSC scenario was successfully applied to model the broadband SED of BL Lacs, while the SEDs of FSRQs are better explained by EIC models. Other possible processes used to model the SEDs of blazars invoke the acceleration and emission of jet accelerated protons. Recently, these models were more frequently applied to model multiwavelength and multimessenger observations of TXS 0506+056 – the first cosmic neutrino source (Ansoldi et al. 2018; Gao et al. 2019; Cerruti et al. 2019; Keivani et al. 2018; Murase et al. 2018; Liao et al. 2018; Wang et al. 2018; Sahakyan 2018; Liu et al. 2019; Xue et al. 2019) as well as its neighboring blazar PKS 0502+049 (Sahakyan 2019).
CTA 102 is one of the bright blazars observed by the Fermi Large Area Telescope (Fermi-LAT) in the HE γ-ray band. Even with its large distance, z = 1.037, CTA 102 sometimes shows a strong γ-ray outburst with a flux exceeding 10−5 photon cm−2 s−1. For example, on 16 December 2016 (during the prolonged γ-ray activity) within 4.31 min, the γ-ray flux above 100 MeV was as high as (3.55 ± 0.55)×10−5 photon cm−2 s−1, corresponding to an isotropic γ-ray luminosity of Lγ = 3.25 × 1050 erg s−1. This is among the highest luminosities observed in the γ-ray band so far (Gasparyan et al. 2018). In addition, Shukla et al. (2018) show that the γ-ray flux variation time can be as short as approximately five minutes. The analysis of multiwavelength light curves show correlated variations in all the observed energy bands, indicating a cospatial origin of the emissions (Kaur & Baliyan 2018; Gasparyan et al. 2018). The broadband emission of CTA 102 is better modeled when the photons that are external to the jet (infrared photons from the torus) are considered Gasparyan et al. (2018). As an alternative interpretation, the ablation of a gas cloud penetrating the relativistic jet of CTA 102 have been discussed to be the source of the observed emission (Zacharias et al. 2017, 2019).
The previous studies indicate a deviation of the γ-ray spectra of CTA 102 from a power-law model at HEs (Kaur & Baliyan 2018; Gasparyan et al. 2018). Such breaks have already been observed in the γ-ray spectra of several blazars that can be of different origin, which varies from source to source. In principle, if the emitting region is within the BLR sharp breaks in the γ-ray, spectra are expected to be due to strong attenuation of the HE and very high energy (>100 GeV; VHE) photons through their interaction with the optical photons. The optical depth due to the interaction of several tens of GeV photons can be very large, preventing their escape from the region. So, if the break is caused by the absorption, it puts a constraint on the location of the γ-ray emitting region, which is crucial in the modeling of the observed data. Of course, a possible break in the GeV spectra does not necessarily imply absorption due to BLR photons; such a break can also be due to the underlying (radiating) electrons with energy distributions deviating from a power-law spectrum. Since the γ-ray emission is caused by the IC up-scattering of low energy photons, the shape of the γ-ray spectra is directly related to the energy distribution of accelerated electrons. Thus, the modeling of the γ-ray spectra with a break can allow one to probe the highest tail of the energy distribution of underlying electrons, which is formed in the interplay between the acceleration and cooling of the particles. So, this is a powerful tool for diagnosing the physics of particles in the jets. A curvature (break), if statistically significant, contains a wealth of information on the possible location of the emitting region and/or on the acceleration and cooling of the particles. In this regard, CTA 102 is an ideal target considering the previous indication of deviation of its γ-ray spectrum from a power-law model and availability of a large amount of simultaneous multiwavelength data.
This paper is organized as follows. The γ-ray data analysis is presented in Sect. 2. The origin of the observed breaks is investigated in Sect. 3. In Sect. 4, the origin of multiwavelength emission is discussed for a different location of the emission region. The formation of the energy distribution of radiating electrons while taking into account their acceleration and cooling is investigated in Sect. 5. The results are presented and discussed in Sect. 6, whereas the conclusion is summarized in Sect. 7.
2. Fermi-LAT observations
The Fermi-LAT data accumulated from 1 January 2016 to 1 April 2018, when the large-amplitude flaring activities of CTA 102 occurred, are analyzed. LAT on board the Fermi satellite is a pair-conversion telescope that is sensitive to HE γ-rays in the 20 MeV–300 GeV energy range (Atwood et al. 2009). It has been collecting data since 2008 and scans the entire sky approximately every three hours, thereby providing the most detailed view of nonthermal HE processes occurring in the astrophysical sources. The PASS8 version of the data in the energy range between 100 MeV and 300 GeV were analyzed using Fermi-LAT Science Tool version 1.0.10 with the instrument response function P8R2_SOURCE_V6. The entire data set was filtered with gtselect and gtmktime tools and only the events with a high probability of being photons evclass=128, evtype=3 were considered. The zenith angle cut-off >90° was chosen to exclude atmospheric γ-rays from the Earth limb that can be a significant source of background. The data downloaded from a region defined as a circle of a 12° radius centered at the γ-ray position of CTA 102 (RA, Dec) = (338.152, 11.731) were binned within a 16.9° × 16.9° square region with the gtbin tool with a stereographic projection into 0.1° ×0.1° pixels. The model file describing the region of interest was generated using the Fermi-LAT fourth source catalog (4FGL; The Fermi-LAT Collaboration 2019) where the sources within 12° + 5° from the position of CTA 102 are included. The model file also contains the standard Galactic gll_ iem _ v07 and isotropic iso_P8R3_SOURCE_V2_v1 diffuse components. The normalization of background models as well as the fluxes and spectral indices of the sources within 12° were left as free parameters during the analysis. Initially, the binned likelihood analyses were applied to the full time data set adopting a log-parabola spectrum for CTA 102; however, for the light curve calculations, a power-law model was used. The photon indices for all of the background sources were fixed to the obtained best guess values in order to reduce the uncertainties in the flux estimations in short periods. The γ-ray light curve was calculated with the unbinned likelihood analysis method implemented in the gtlike tool with the appropriate quality cuts as applied in the data selection. The γ-ray light curve with one-day binning is shown in Fig. 1. An interesting evolution of the γ-ray flux can be noticed: The source alternates in and out of its flaring state, with the highest flux being observed on 57750 MJD, which corresponds to (2.12 ± 0.07)×10−5 photon cm−2 s−1 while the hardest photon index is 1.80 ± 0.06 observed on MJD 57424. This source is variable in timescales for less than a day; however, the observed spectra extend only up to moderate energies for shorter periods, thus preventing detailed spectral analyses. Since the curvature in the γ-ray spectra of CTA 102 is intended to study; the periods >1 day are considered to gather sufficient statistics. For a detailed study of the γ-ray light curve of CTA 102 in short and long time scales as well as in the multiwavelength context see Gasparyan et al. (2018).
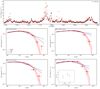 |
Fig. 1. Upper panel: γ-ray light curve of CTA 102 with 1-day time bins from 01 January 2016 to 01 April 2018. Lower panels: γ-ray spectra in the energy range from 100 MeV to 300 GeV for the periods that showed significant deviation from the simple power-law model. The power-law with exponential cut-off spectral model (dashed red line) with the fit uncertainties (red solid lines) are shown together with the spectral points and it is compared with other adopted models (broken power-law in blue and log parabola in black). The spectral points are obtained by separately running gtlike for smaller energy intervals. |
The spectra of CTA 102 in 0.1–300 GeV band are investigated by detailed spectral analyses. In order to identify the periods where the spectrum significantly deviates from a simple power-law model, the data with different time binning (from one to six days) were analyzed. However, the time-averaged γ-ray spectrum of CTA 102 is characterized by a soft photon index with a smooth break at higher energies. Therefore, only the periods in which a harder photon index was observed were considered further (e.g., Γ ≤ 2.1). This allows one to select only the periods exhibiting substantially different properties, as compared with those observed in the quiescent state, from the flaring states. Then, for each period, plots of counts per bin versus energy and residuals between the model and the data were generated while comparing the assumed power low spectrum with the observed data. Among the selected periods, when the power-law model explains, reasonably well, why the observed data have been excluded, only the periods remain in which a hint of a possible deviation from a power-law model is present. Then, in order to check for a statistically significant curvature in the spectrum, an alternative fit with the following functions were considered as follows: a power law with an exponential cut-off (PLEC) in the form of
 (1)
(1)
a log-parabola (LP), defined as
 (2)
(2)
and a broken power law (BPL), defined as
 (3)
(3)
Different models were compared using a log likelihood ratio test when the significance was estimated as twice the difference in the log-likelihoods. The spectral parameters of CTA 102 were considered as free parameters during the analyses, while the photon indices of all sources within the ROI were fixed to the values obtained during the entire analysis. The best matches between the spectral models and events are obtained using an unbinned analysis method. Then, the spectrum of CTA 102 for each period was calculated by separately running the gtlike tool for equal logarithmically-spaced energy bins.
The spectral models given in Eqs. (1) and (2) were used to model the spectrum of CTA 102 in each single period, and the significance of the curvature was estimated by comparing each model with the power-law. Although, in almost all of the considered time intervals (from one to six days), a statistically significant curvature in the γ-ray spectra was observed; the most significant is in five-day bins. The CTA 102 spectra deviating from a simple power-law model with a significance exceeding 5σ are shown in the lower panel of Fig. 1 and the corresponding parameters are given in Table 1. The data fit with PLEC (red), BPL (blue), and LP (black) models are shown. As the fitting provides only log-likelihood values, the models cannot be directly compared. Therefore, the goodness of the fit (χ2), which compares the data points with the models, was computed. This shows that the PLEC model is preferable for all the periods; other models yield a noticeably worse fit. These periods are characterized by a relatively hard photon index (Γ = 1.84−1.98) and a cut-off around tens of GeV, which does not change significantly in different periods (Ecut = 9.40−16.12 GeV). The variation of Ecut with the flux is shown in the inset of the lower panel in Fig. 1. In the considered period, the flux and cut-off do not vary significantly. A similar conclusion can be drawn when the BPL model is considered (although it fails to explain the data observed at higher energies): The break energy varies around Ebr ≃ 1.0 GeV.
Parameters of fitting with PLEC model in the periods showing deviation from the power-law model.
3. Absorption of γ-rays
The curvature of the γ-ray spectrum of CTA 102, reported in the previous section, can be of different origin. In principle, it can be due to absorption when the GeV γ-rays interact with the low energy photons (through γγ collision) or it can be related to similar steepening in the spectrum of the emitting particle distribution due to the interplay of acceleration and cooling processes. Understanding the exact nature of this steepening can help to investigate the processes taking place in the jet of CTA 102 or it can help to localize the γ-ray emitting region.
The γ-rays can be absorbed either inside the source interacting with the photons reprocessed from BLR or during their propagation interacting with extragalactic background light (EBL) photons. Considering the distance of CTA 102 (z = 1.037), the absorption due to interaction with EBL photons is significant for energies ≥(200−300) GeV, as shown in in the right panel of Fig. 2 (dot-dashed blue line) where the extrapolation of only the power-law component (∼E−1.84) observed in MJD 57748−57753 corrected for EBL absorption using the model from Domínguez et al. (2011). Such absorption cannot explain the observed steeping of the spectrum at lower energies. In addition, if the emitting region is inside the BLR, the photons can also be effectively absorbed when interacting with the optical photons. Following the treatment of Finke (2016), the optical depth was calculated by modeling the BLR as infinitesimally thin spherical shells or thin rings. The luminosity and radius of the shells or rings were estimated using the composite quasar spectrum from the SDSS (Vanden Berk et al. 2001) in terms of LHβ luminosity, which is LHβ = (8.93 ± 6.00)×1043 erg s−1 for CTA 102 (Meyer et al. 2019). The absorption is dominated by Lyα photons at the radii 1.61 × 1017 cm (see Finke (2016), for further details) although the absorption by other lines is not negligible. The direct absorption by the photons from the accretion disk was not considered as it is significant at ≥TeV γ-ray energies (Donea & Protheroe 2003; Reimer 2007; Finke 2016). The attenuation (e−τ(Eγ, R)) strongly depends on the distance from the central object and the energy of photons. For example, the plot of attenuation versus the distance is shown in Fig. 2 (left panel) for different distances of an emitting region and for photons with energies of 10, 60, 300, and 1000 GeV. The region is optically thin for 10 GeV photons (blue line in Fig. 2), which escape it unabsorbed. Instead, the higher-energy photons are heavily absorbed when the emitting region is inside the BLR (dashed, dot-dashed, and dotted blue lines in Fig. 2 left panel). The absorption decreases at larger distances making a small contribution at >10RLyα. It is important to note that a similar result was obtained for a different geometry of BLR (Zacharias et al. 2019).
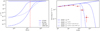 |
Fig. 2. Left panel: internal BLR absorption as a function of distance for different γ-ray energies. The red dot-dashed line shows the RLyα radius. Right panel: reconstructed power-law model compared with the data considering external (EBL) and internal absorptions. The latter was computed assuming the emission region is at ∼50 rg (doted blue line) and at ∼1000 rg (dot-dashed blue line) distances from the central source. |
The effect of attenuation due to the interaction with BLR photons in the extrapolated power-law spectrum for different distances of the emitting region is shown in Fig. 2 (right panel) where a factor of (1 + z) is taken into account for the energy as the absorption is in the galaxy frame. When the compact emitting region is at a distance of R = 50 * rg (where rg = 1.26 × 1014 cm is the gravitational radius for the CTA 102 black hole mass of M = 8.51 × 10⁸ M⊙ (Zamaninasab et al. 2014), the emitted flux sharply decreases at energies >10 GeV and cannot explain the observed data (dotted line in Fig. 2 right panel). When the region is close to the distance of BLR, R = 1000 * rg, the flux drops slowly but still can not describe the observed spectra (dot-dashed blue line in Fig. 2 right panel): The model overproduces the flux observed around 10 GeV. For further distances, the absorption becomes less significant and the observed steepening cannot be interpreted by BLR absorption. On the other hand, the observed variability time-scales put an additional constraint on the distance of the emitting region. For example, in Prince et al. (2018) using a six-hour binned light curve of Fermi-LAT data, the flux doubling time around MJD 57752 is 5.05 ± 0.85 h (flare3 in Prince et al. 2018). This implies that the size of the emitting region is constrained by Rγ ≤ δ × c × tvar/(1 + z)≃2.68 × 10¹⁴ × δ cm where δ is the Doppler factor, which is equal to the bulk Lorentz factor for a small viewing angle (δ ≃ Γ). By using VLBA data, a bulk Lorentz factor of ≥17.5 and a jet half opening angle of  were estimated for CTA 102 (Li et al. 2018). So, if the entire jet width is responsible for the emission, the emitting region along the jet should be at the distance of ∼Rγ/θj ≃ 1.49 × 1017 cm, which is close to the upper edge of BLR. As discussed above, the absorption is relatively weak and cannot account for the observed steepening at these distances.
4. Origin of multiwavelength emission
Even at very close distances from the central source, the absorption due to the interaction with BLR photons cannot explain the observed steepening in the CTA 102 spectra. These breaks are most likely related with an intrinsic break in the spectrum of the radiating particles (electrons). Considering the available, large amount of multiwavelength data from the observations of CTA 102, their modeling is crucial in estimating the underlying particle energy distribution, which in turn allows one to study the particle acceleration and cooling processes.
The multiwavelngth SED of CTA 102 is shown in Fig. 3 where the Swift UVOT/XRT data are from Gasparyan et al. (2018) for the period 3 (MJD 57752.52). For the NuStar data, the same analysis described in Gasparyan et al. (2018) was repeated, but only for the counts up to 45 keV in which the X-ray spectra of CTA 102 that are above the background were extracted. The γ-ray data were accumulated for the period from MJD 57748 to MJD 57753. The data in the mm and sub-mm band are from the ALMA catalog from the observations of bright compact radio sources in different bands between May 2011 and July 2018 (Bonato et al. 2019). From the many observations of CTA 102, only the data from the observations carried out on 17, 18, and 29 December 2016 and on 8 January 2017, which are nearly simultaneous with the period of studied flare, were considered. For comparison purposes, the time averaged data from CTA 102 observations are shown in light gray, highlighting the changes observed in different energy bands.
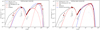 |
Fig. 3. SED of CTA 102 for the period from MJD 57748 to MJD 57753. The archival data are shown in light gray. The models are shown assuming the emitting region is inside the BLR (left panel) and outside the BLR (right panel). Different models are noted in the plot legend and the model parameters are given in the text. |
A deviation from the power-law model has been observed in the spectra of several blazars (e.g., Abdo et al. 2009, 2010b; Harris et al. 2012; Kohler & Nalewajko 2015; Rani et al. 2013; Paliya 2015; Paliya et al. 2015; Ding et al. 2019). The internal or external attenuation cannot be responsible for the observed steepening as demonstrated in Sect. 3. This is in agreement with the study of the spectra of 106 broad-line blazars detected in the MeV/GeV bands showing no evidence of expected BLR absorption (Costamante et al. 2018). Therefore, the steepening is most likely caused by either a similar feature that is present in the spectra of the emitting electrons or by the transition of IC scattering from Thomson to Klein–Nishina regimes. The IC scattering occurs in the Klein–Nishina regime when  . So, when the IC scattering of synchrotron photons (peaking in infrared to optical bands) or IR photons from dusty torus are considered, the IC scattering to MeV and GeV energies typically occurs in the Thomson regime. In contrast, when BLR photons are considered, the IC scattering to the same energies is in the Klein–Nishina regime. The break energy in the γ-ray spectrum naturally formed by the Klein–Nishina effects on the Compton scattering, depends on the target photon energy, and is independent of δ (Ghisellini & Tavecchio 2009; Ackermann et al. 2010). By considering different values for the target photon field, the cut-off at energies observed for CTA 102 can be reproduced by the Klein–Nishina effect. However, considering the limited information available about the BLR photons, this would only be based on inferred assumptions rather than on a real physical picture. Instead, if the break is caused by the particles and when the parameters describing the energy distribution of the particles are constrained, the physics of jets can be explored. During the modeling, different distances for the emission region is assumed (inside and outside BLR) and all the relevant photon fields as well as the Klein–Nishina effects on the IC scattering are taken into account.
A one-zone leptonic emission scenario was used assuming that the emitting electrons are confined in a compact spherical region with a radius of ≃2.68 × 10¹⁴ × δ cm and a magnetic field intensity of B. Due to the relativistic motion of the jet, the radiation is Doppler boosted by δ = Γ ≥ 17.5 (Li et al. 2018) and appears brighter for the observer. For the underlying particles, a PLEC distribution within  and
and  is assumed:
![Mathematical equation: $$ \begin{aligned} N(E_{\rm e}) = (E_{\rm e}/m_{\rm e} c^2)^{-\alpha }\exp (-E_{\rm e}/E_{\rm c})\,[\mathrm{eV^{-1}}] , \end{aligned} $$](/articles/aa/full_html/2020/03/aa36715-19/aa36715-19-eq9.gif) (4)
(4)
considering the total energy of electrons,  , as a free parameter during the fitting. The free model parameters were estimated using the Markov chain Monte Carlo (MCMC) method, which enables one to derive the confidence intervals for each parameter (the application of the method and the used code are described in Sahakyan & Gasparyan 2017 and Gasparyan et al. 2018).
4.1. Emitting region inside the BLR
When the emitting region is inside the BLR, the dominant photon fields that are IC up-scattering to X-ray–γ-ray bands are synchrotron photons and disc-emitted photons reflected from the BLR. The IC scattering of only synchrotron photons with ∼1 eV peak energy on the electron population with an energy distribution with a cut at Ecut ≤ 1.6 × (B/1 G)−1/2 × (δ/17.5)−1/2 GeV (constrained from Es, peak ≤ 1 eV) extend only up to (1.8−2) GeV, which is insufficient to explain the observed data (see blue line in Fig. 3 left panel). Considering 10% of the disc emission is reflected from BLR with a radius of RBLR = 1017 (Ld/1045)0.5 = 6.3 × 1017 cm (where Ldisc = 10 × LBLR ≃ 4.0 × 1046 erg s−1 Pian et al. 2005), the external photon field density in the jet frame is  . This over-exceeds the synchrotron photon density when high Doppler boosting is assumed, for example, δ = 30, which is more typical for powerful blazars. In this case, when α = 1.81 ± 0.09,
  above
above  and the magnetic field in the emitting region is B = 8.24 ± 0.18 G, the EIC peaks around GeV energies, explaining the γ-ray data, while the X-rays are due to SSC radiation (red line in Fig. 3 left panel). Because of the high magnetic field that is necessary to explain the UV and X-ray data by synchrotron and SSC processes, the electron distribution should have a lower cut-off energy (
 ), which does not allow satisfactory modeling of the observed data at HEs. In this case, the jet is magnetic field dominated with Ue/UB = 0.06. In principle the magnetic field can be reduced by increasing the total energy of the emitting electrons, in which case the IC overproduces the γ-ray data below ∼1 GeV.
The required magnetic field can be decreased in an alternative model where the X-ray to γ-ray emission is due to IC up-scattering of only BLR photons (black line in Fig. 3 left panel). Then, when δ = 17.5, the estimated magnetic field is lower, B = 3.68 ± 0.04 G, and  with α = 2.18 ± 0.003, allowing one to model the observed data. The low-energy tail of the HE component can only reproduce the X-ray data at lower
  (normally it is expected that γmin = Emin/mec2 should be close to unity Celotti & Ghisellini 2008). However, the synchrotron emission of such low-energy electrons overproduces the observed radio flux, but one should note that synchrotron-self absorption is not taken into account, which is significant below 4 × 10⁻² eV (Gasparyan et al. 2018).
4.2. Emitting region outside the BLR
When the emitting region is beyond the BLR (e.g., at > 0.2pc), the IR photons from the dusty torus (RIR = 1018 (Ld/1045)0.5 = 6.32 × 1018 cm Ghisellini & Tavecchio 2009) with  density dominate over that of the BLR-reflected photons, which decrease as ∼UBLR/(1 + (R/RBLR)3) beyond RBLR. In the right panel of Fig. 3, the SED modeling when both the synchrotron and torus photons are considered is shown with a red solid line (for δ = 30). Again, as in the previous case, a high magnetic field B = 2.39 ± 0.04 G is required (although slightly lower as the energy density of torus photons compared with BLR photons is lower), and the X-ray data can be explained by an SSC mechanism. As the average energy of IR photons with ∼103 K temperature is lower than that of BLR photons (∼104 K), their IC up-scattering (∼δγ2(kbT)) can explain the observed γ-ray data when
  ; the synchrotron emission of these electrons slightly overproduces the soft X-ray data (red solid line in the right panel of Fig. 3).
A fit that assumes the X-ray and γ-ray data are due to IC up-scattering of only torus photons is shown in the right panel of Fig. 3 (black solid line). As the magnetic field is low, B = 1.13 ± 0.01 G, the SSC component falls below the observed X-ray data. The power-law index of underlying electrons, α = 2.18 ± 0.004, is defined by joint X-ray and γ-ray data (see next section). The minimum and cut-off energies of underlying electrons are estimated to be  and
and  , respectively.
Further, it is assumed that the radio-optical–X-ray and γ-ray emissions are produced in different regions (blobs). This permits one to estimate the properties of emitting electrons based only on the γ-ray data, without considering the effect of the magnetic field. Such a consideration is motivated by the following: (i) the previous studies of this source showed that the regions outside the torus are more favorable for the γ-ray emission (Gasparyan et al. 2018) and (ii) the two-zone models were successful in explaining the bright flares of FSRQs (Tavecchio et al. 2011). In this case, the power-law index of the emitting electrons is α = 2.36 ± 0.07, which is much softer than in the previous cases that result in a larger cut-off energy  . Since the X-ray data are considered as an upper limit, a larger
  is obtained (red dot-dashed line in the right panel of Fig. 3). The jet should be very strongly particle dominated, Ue/UB ≫ 1 and the synchrotron emission of these electrons in the second region does not make a significant contribution to the low energy band. Such a modeling gives independent information on the particle content and distribution since the luminosity of IC scattering only depends on Ne as distinct from the synchrotron or SSC components when the luminosity depends on the product of B2 and Ne. Therefore, this provides straightforward information on the jet-accelerated particles.
The results obtained above do not significantly differ from those obtained in the previous studies of CTA 102 within one-zone leptonic scenarios (e.g., Prince et al. 2018; Gasparyan et al. 2018). However, it is impossible to compare the obtained parameters directly because different values of emitting region size, such as Doppler boosting, were used in the mentioned studies. The change in the initial set of the model parameters impacts the estimation of other free parameters of the model. Also, the SED considered and modeled here differs from the previously modeled ones and for different periods, the model parameters might vary.
5. Particle acceleration and energy losses
One of the effective ways to study the physics of the jets is through the modeling of their multiwavelength emission spectra. The applied models can reproduce and explain the data observed in a short time period, which is not enough in order to understand the global processes occurring in jets given the extremely variable character of their emission. However, any model trying to reproduce the transfer of the radiative output along the jet propagation should be able to explain single snapshots of the SEDs. The SED discussed here is important as the curvature in the γ-ray spectrum is most likely related with the similar feature in the emitting electron distribution, allowing for the possibility to explore the particle acceleration and cooling mechanisms.
The electron energy distributions given by Eq. (4) that can explain the observed broadband emission of CTA 102 are shown in Fig. 4. The free model parameters (Ue, B, α, and  ) were extracted straightforwardly from the observed data using the MCMC method. In order to investigate the conditions for the formation of the electron energy distribution, a detailed simulation of both the acceleration of particles and the treatment of temporal evolution of electrons that take relevant energy losses into account (e.g, solving the kinetic equation) are required (e.g., Chiaberge & Ghisellini 1999). Nevertheless, this is beyond the scope of this paper. Based on the estimated parameters, here, an attempt was made to put only quantitative constraints on the physical processes at work in the jet of CTA 102.
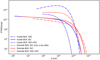 |
Fig. 4. Energy distribution of the electrons for the models presented in Fig. 3 obtained by MCMC modeling of the observed data. |
It is widely discussed that one of the most efficient mechanisms for energizing the particles in the relativistic jets of blazars is the first-order Fermi acceleration diffuse shock acceleration (DSA; Kirk & Heavens 1989; Ellison et al. 1990; Summerlin & Baring 2012). A distinctive feature of this acceleration process, both for relativistic and non-relativistic shocks, is that the resulting particle energy distribution takes a power-law form ( ) (Drury 1983). Under dominant radiative cooling and/or a decreasing chance for HE particles to cross the shock front several times, the HE tail of the electron energy distribution steepens and forms a power-law with an exponential cut-off distribution. So, the investigation of α and
  parameters can shed light on the physics of the jet.
5.1. High energy cut-off in the electron spectrum
The HE tail of electron distribution is defined by the cooling of emitting particles, which in turn strongly depends on the location of the emitting region. For example, when the emitting region is within the BLR that has a higher density, the particle cooling is more efficient and they do not reach higher energies as compared to the case when the emitting region is outside the BLR (see Fig. 4). The cut-off electron energy is constrained by the two conditions as follows. First, the particles are not accelerated beyond the energies when the cooling and acceleration times are equal. Second, the particles do not continue to accelerate beyond the energies permitted by the physical size of the emitting zone: Ec is determined as the smaller of these limiting values.
When the acceleration and cooling times are of the same order, the macroscopic parameters of the jet plasma start to play a crucial role and, basically, they define the formed spectrum of emitting electrons. In the collisionless shock, the non-thermal particles gain energy by scattering between turbulence in the upstream and downstream of the plasma. The corresponding time for diffuse shock acceleration would be (Drury 1983; Rieger et al. 2007)
 (5)
(5)
where p is the particle momentum, αdiff is the diffusion index, η ∼ pαdiff−1 characterizes the diffusion (η = 1 corresponds to Bohm limit), u ∼ c is the shock speed, and  . By balancing this acceleration time with the electron cooling time defined as
 (6)
(6)
where  and by introducing the cooling parameter ϵsyn, which is defined as a ratio of the luminosity of a low-energy component to the total luminosity, Llow/(Llow + Lγ). Baring et al. (2017) show that the cut-off energy of the accelerated electrons scales with the magnetic field as
  where ℰs(αdiff)≃3/2(9ϵsyn/4)2/(1 + αdiff) (assuming u ∼ c). Through this equation, αdiff and η0 are connected as
  so when the magnetic field in the jet and the cut-off energy are known (e.g., from the multiwavelength data modeling), these parameters can be constrained. For CTA 102, when the emitting region is outside the BLR and when the multiwavelength emission is described by synchrotron as well as SSC and EIC process, then B = 2.39 ± 0.04 G and
  (γc ≃ 3.× 103). For a fixed magnetic field and cut-off energy, η0 scales inversely with αdiff, for example, for Bohm type diffusion (αdiff = 1) an unrealistically large η0 ≃ 107 is needed (considering ϵsyn = 0.14). More relaxed parameters are obtained when αdiff > 2: η0 ≃ 3 × 10⁴ for αdiff = 2 and η0 ≃ 10 for αdiff = 3.0. Similarly, when the data are modeled by EIC of BLR photons, when αdiff = 2.0 then η0 is 8 × 10³ and η is 2.1 when αdiff = 3. These parameters indicate diffusion away from the Bohm limit with a stronger dependence of the mean free path on the momentum (∼p2). A larger value of η0 implies that turbulence levels are gradually decreasing when farther from the shock. Similar values were obtained in the modeling of multiwavelength emission from BL Lacerte and AO 0235+164 when the DSA of particles was treated with detailed Monte Carlo simulations (Baring et al. 2017), and η0 = 105 was used to reproduce the broadband SED of Mrk 421 (Inoue & Takahara 1996).
When the dynamic time scales of the system are shorter than the acceleration times, the cut-off determined from tdyn = tcool corresponds to  . If the observed γ-rays are produced in a separate region under the dominant IC cooling of torus photons, the cut-off is
  . For the variability time on the order of 5.05 ± 0.85 h, the cut-off should be at
  , which is similar to the value estimated during the fit. This shows that the curvature in the electron spectrum might also come from a limitation from the acceleration zone.
5.2. Power-law index of emitting electrons
The power-law index of the emitting electrons is simulation-dependent and is strictly defined by the plasma parameters. Alternatively, it can be obtained through the modeling of the observed photon spectra and in some cases analytically as well. When the HE component is interpreted by IC up-scattering of the external photon field, the particle photon index is defined by α = 2Γγ/X-ray − 1 (e.g., Ghisellini 2013). In the case of CTA 102, both X-ray and γ-ray data define the photon index (αγ/X-ray), which can be obtained by fitting with a power-law function (∼(E/100 eV)−Γγ/X-ray). As for the BLR and torus photons, IC scattering near the minimum energy of electrons (γmin close to unity) is around ∼(0.5−0.7) keV and above ∼1 GeV where the γ-ray spectrum steepens. It is important to note that only the data observed between ∼0.7 keV and ∼1 GeV are considered. The fit results in Γγ/X-ray = 1.60 ± 0.01, meaning that α should be around 2.2, which matches well with the estimated value of 2.18. In the case of the SSC and EIC scenario, the power-law index is mostly, but not entirely, defined by fitting the SSC component to X-ray data with a slope of 1.32. The SSC component can explain the X-ray data when assuming a hard ∼1.6 index for electron distribution, but the EIC of these electrons is steeper in the MeV and GeV band, which is in disagreement with the observed data. The modeling resulted in a slightly different yet still hard spectrum for the electrons α = (1.7−1.8).
From the standpoint of shock acceleration theories, the electron indexes discussed above can be easily formed under reasonable physical conditions. The DSA of particles establishes a power-law distribution of electrons with an index that only depends on the shock velocity compression ratio (α = (r + 2)/(r − 1)) (Bell 1978; Blandford & Eichler 1987; Jones & Ellison 1991). In the case of non-relativistic shocks with a large sonic Mach number r = 4, the well known E−2 spectrum is formed. When relativistic shocks are considered, the situation changes because the assumptions made in deriving the spatial diffusion equation are no longer valid and the index is defined by the shock speed and also depends on the nature of particle scattering. For a test particle in the parallel relativistic shocks, the particles are distributed by a universal power-law index of −2.23 (Kirk et al. 2000; Ellison & Double 2004; Bednarz & Ostrowski 1998). However, power-law indexes can vary from very hard (−1) to very steep, depending on the nature and magnitude of turbulence, shock speed, and shock field obliquity (Summerlin & Baring 2012). One of the best ways to study the DSA of particles is through Monte Carlo simulations (although some analytical approaches were applied as well). However, making a detailed treatment of the shock speed and particle scattering, for instance, is beyond the scope of the current paper. The obtained power-law indexes from 1.8 to 2.18 are well within the values discussed for shock acceleration theories to date.
6. Results and discussion
The distinct blazar variability in almost all wavebands makes them ideal targets for exploring the particle acceleration and emission processes. Due to the processes causing the flares, the spectra of the sources sometimes exhibit dramatic changes in both amplitude and spectrum. So, the multiwavelength observations in these periods and their modeling can significantly help to infer and understand the physical processes at work in relativistic jets.
The CTA 102 blazar is one of the brightest γ-ray emitters in the extragalactic sky. The source is frequently in a flaring state; the most dramatic variability is demonstrated in the γ-ray band. The source showed prolonged activity in 2016–2017 when the observed daily highest flux was (2.12 ± 0.07)×10−5 photon cm−2 s−1, corresponding to ∼2.02 × 1049 erg s−1 luminosity. The γ-ray flux in the proper frame of the jet is Lγ = 3.3 × 1046 erg s−1, implying that an energy that is much higher than 2.8 × 1051 erg (>t1 day × Lγ) should be released in the form of a magnetic field and particles in order to explain the γ-ray emission.
The time-averaged γ-ray spectrum of CTA 102 is best described by a log-parabola model with α = 2.26 and β = 0.1, while in short time scales a substantial harder emission, Γ < 2.0, with a spectrum curving at HEs was observed. Such periods were identified in the light curves with bins from one to six days. Among many periods with a hint of curvature, the γ-ray data are statistically significantly better (>7σ) in at least four of them; this entails a power-law with an exponential cut-off. All these periods were during MJD 57738−57763 when the source was in a high γ-ray flaring state. During these periods the cut-off energy (9.0–16.0 GeV) was relatively stable, implying that it could be due to a generic feature of the process at work in the jet of CTA 102. This cut-off is somewhat different than that observed in the time-averaged spectrum of CTA 102 and it is clearly related with its flaring activity. External absorption can be ruled out as it is significant only for the energies above 100–200 GeV for the distance of CTA 102. Internal absorption cannot account for the observed curvature either. When the emitting region is very deep inside BLR (e.g., ∼50rg), the spectrum steepens quickly, which is in disagreement with the observed data. Whereas for larger distances (e.g., ∼1000rg), the slow drop of the flux overproduces the data observed around 10 GeV. On the other hand, the observed variability time as well as the estimated bulk Lorentz factor and the jet half opening angle put a constraint on the location of the γ-ray emitting region, which should be around the upper edge or outside the BLR region. The curvature observed in the γ-ray band is most likely due to a break and cut-off in the spectrum of radiating particles.
The broadband SED of CTA 102 was modeled considering that the jet dissipation occurs close (within BLR) or far from (outside BLR) the central source. The synchrotron, BLR reflected, and torus photons were considered to explain the HE component in the SED of CTA 102. The free model parameters were estimated using the MCMC method. The observed X-ray data correspond to the low-energy tail of the IC component, which limits the emitting electron maximum energy, and the SSC component can only reach 1−2 GeV. This prevents one from modeling the observed data. When the jet plasma moves with a bulk Lorentz factor of Γ = δ = 30, the density of BLR and torus photons is comparable with or dominates over the magnetic field energy density and their IC scattering can make a significant contribution to the γ-ray band. Since their average energy in the jet frame exceeds that of synchrotron photons (peaking around 1 eV), the EIC component extends beyond the SSC and can explain the data above GeV. The combined SSC and EIC model can explain the observed data when the emitting electrons are distributed with a hard power-law index of ≃(1.7−1.8). On the contrary, if the jet of CTA 102 is strongly particle dominated (Ue/UB ≃ (102 − 7 × 10³)) (depressing the SSC component), the IC up-scattering of only BLR or torus photons can explain the X-ray and γ-ray data if the electron distribution with ∼2.2 index extends up to Ec = 2.02 ± 0.04 GeV and Ec = 3.60 ± 0.09 GeV, respectively. The total jet energy (Ljet = LB + Le where  and
and  ) varies within (0.04−2.3)×1047 erg s−1, which is of the same order or less than the Eddington accretion power for the black hole mass in CTA 102. When the γ-rays are produced in a separate region, the power-law index of the electrons (2.36 ± 0.07) and the cut-off energy (5.32 ± 0.75 GeV) are well constrained by the γ-ray data, which are independent of the magnetic field.
The estimated parameters of the electrons provide important information on the particle acceleration in the jet of CTA 102. The power-law index of electrons that were directly estimated from the X-ray or γ-ray data varies from 1.6 to 2.3-values well achievable by the DSA of particles. These values cannot be directly used to put a constraint on the properties of the shock due to the complex character of the acceleration process; it can only be done under several assumptions on the unknown parameters. However, the power-law index of electron distribution that is capable of explaining the data is physically realistic and it can be formed in standard relativistic shocks. On the other hand, the constraint on the cut-off of the electron distribution provides crucial information about the diffusion of particles; from the balance of acceleration and cooling times, the diffusion index should be αdiff > 2.0 with η > 104, implying that in the acceleration zone of the CTA 102 jet, the particle diffusion must be well removed from the Bohm limit (η = 1 and αdiff = 1). These parameters show that the physical environment in the jet of CTA 102 should have a lower-level turbulence at large distances from the shocks, which results in longer diffusive mean free paths for larger momenta. These conditions are not physically unrealistic and can be formed under certain circumstances. For further discussion see Baring et al. (2017) and the references therein.
7. Conclusions
The origin of the curvature in the γ-ray spectra of CTA 102 is investigated. During bright γ-ray flaring of CTA 102, its emission spectrum hardened; steepening above ∼10 GeV and the data are better (>7σ) described by a power-law with an exponential cut-off model. The estimated cut-off energy remains relatively unchanged when taking the uncertainties into account.
The modeling of the SED of CTA 102 allowed us to constrain the free model parameters with their uncertainties, which in its turn provided information on the particle acceleration. The electron spectrum can be easily formed by diffusive shock acceleration, but it is required that the diffusion occurs well beyond the Bohm limit. The prolonged γ-ray flaring activity of the source in 2016−2017 could be, in principle, due to such changes in the jet of CTA 102.
Here, a single snapshot of the SED of CTA 102 is modeled, providing valuable information about particle acceleration and cooling processes. The observation, identification, and modeling of different flaring periods characterized by a curvature in the γ-ray spectrum can eventually help to draw a clear picture of the global processes taking place in the blazar jets.
Acknowledgments
This work was supported by the RA MES State Committee of Science, in the frames of the research project No. 18T-1C335. This work used resources from the ASNET cloud and the EGI infrastructure with the dedicated support of CESGA (Spain).
References
- Abdo, A. A., Ackermann, M., Ajello, M., et al. 2009, ApJ, 699, 817 [NASA ADS] [CrossRef] [Google Scholar]
- Abdo, A. A., Ackermann, M., Agudo, I., et al. 2010a, ApJ, 716, 30 [NASA ADS] [CrossRef] [Google Scholar]
- Abdo, A. A., Ackermann, M., Ajello, M., et al. 2010b, ApJ, 710, 1271 [NASA ADS] [CrossRef] [Google Scholar]
- Ackermann, M., Ajello, M., Baldini, L., et al. 2010, ApJ, 721, 1383 [NASA ADS] [CrossRef] [Google Scholar]
- Ackermann, M., Anantua, R., Asano, K., et al. 2016, ApJ, 824, L20 [NASA ADS] [CrossRef] [Google Scholar]
- Ackermann, M., Ajello, M., Baldini, L., et al. 2017, ApJ, 837, L5 [NASA ADS] [CrossRef] [Google Scholar]
- Aharonian, F. A. 2002, MNRAS, 332, 215 [NASA ADS] [CrossRef] [Google Scholar]
- Ansoldi, S., Antonelli, L. A., Arcaro, C., et al. 2018, ApJ, 863, L10 [NASA ADS] [CrossRef] [Google Scholar]
- Atwood, W. B., Abdo, A. A., Ackermann, M., et al. 2009, ApJ, 697, 1071 [NASA ADS] [CrossRef] [Google Scholar]
- Baring, M. G., Böttcher, M., & Summerlin, E. J. 2017, MNRAS, 464, 4875 [NASA ADS] [CrossRef] [Google Scholar]
- Beall, J. H. 2017, Proceedings of the XII Multifrequency Behaviour of High Energy Cosmic Sources Workshop. 12–17 June, 62 [Google Scholar]
- Bednarz, J., & Ostrowski, M. 1998, Phys. Rev. Lett., 80, 3911 [NASA ADS] [CrossRef] [Google Scholar]
- Bell, A. R. 1978, MNRAS, 182, 147 [NASA ADS] [CrossRef] [Google Scholar]
- Bhattacharyya, W., & Gupta, N. 2016, ApJ, 817, 121 [NASA ADS] [CrossRef] [Google Scholar]
- Blandford, R., & Eichler, D. 1987, Phys. Rep., 154, 1 [Google Scholar]
- Błażejowski, M., Sikora, M., Moderski, R., & Madejski, G. M. 2000, ApJ, 545, 107 [NASA ADS] [CrossRef] [Google Scholar]
- Bloom, S. D., & Marscher, A. P. 1996, ApJ, 461, 657 [NASA ADS] [CrossRef] [Google Scholar]
- Bonato, M., Liuzzo, E., Herranz, D., et al. 2019, MNRAS, 485, 1188 [NASA ADS] [CrossRef] [Google Scholar]
- Breiding, P., Meyer, E. T., Georganopoulos, M., et al. 2017, ApJ, 849, 95 [NASA ADS] [CrossRef] [Google Scholar]
- Breiding, P., Georganopoulos, M., & Meyer, E. T. 2018, ApJ, 853, 19 [NASA ADS] [CrossRef] [Google Scholar]
- Brown, A. M. 2013, MNRAS, 431, 824 [Google Scholar]
- Celotti, A., & Ghisellini, G. 2008, MNRAS, 385, 283 [NASA ADS] [CrossRef] [Google Scholar]
- Celotti, A., Ghisellini, G., & Chiaberge, M. 2001, MNRAS, 321, L1 [NASA ADS] [CrossRef] [Google Scholar]
- Cerruti, M., Zech, A., Boisson, C., et al. 2019, MNRAS, 483, L12 [NASA ADS] [CrossRef] [Google Scholar]
- Chiaberge, M., & Ghisellini, G. 1999, MNRAS, 306, 551 [NASA ADS] [CrossRef] [Google Scholar]
- Costamante, L., Cutini, S., Tosti, G., Antolini, E., & Tramacere, A. 2018, MNRAS, 477, 4749 [NASA ADS] [CrossRef] [Google Scholar]
- de Gouveia Dal Pino, E. M. 2005, AdSpR, 35, 908 [Google Scholar]
- Ding, N., Gu, Q. S., Geng, X. F., et al. 2019, ApJ, 881, 125 [NASA ADS] [CrossRef] [Google Scholar]
- Domínguez, A., Primack, J. R., Rosario, D. J., et al. 2011, MNRAS, 410, 2556 [NASA ADS] [CrossRef] [Google Scholar]
- Donea, A.-C., & Protheroe, R. J. 2003, Astropart. Phys., 18, 377 [Google Scholar]
- Drury, L. O. 1983, Rep. Progr. Phys., 46, 973 [Google Scholar]
- Ellison, D. C., & Double, G. P. 2004, Astropart. Phys., 22, 323 [NASA ADS] [CrossRef] [Google Scholar]
- Ellison, D. C., Jones, F. C., & Reynolds, S. P. 1990, ApJ, 360, 702 [NASA ADS] [CrossRef] [Google Scholar]
- Finke, J. D. 2016, ApJ, 830, 94 [Google Scholar]
- Foschini, L., Ghisellini, G., Tavecchio, F., Bonnoli, G., & Stamerra, A. 2011, A&A, 530, A77 [NASA ADS] [CrossRef] [EDP Sciences] [Google Scholar]
- Foschini, L., Bonnoli, G., Ghisellini, G., et al. 2013, A&A, 555, A138 [NASA ADS] [CrossRef] [EDP Sciences] [Google Scholar]
- Gao, S., Fedynitch, A., Winter, W., & Pohl, M. 2019, Nat. Astron., 3, 88 [NASA ADS] [CrossRef] [Google Scholar]
- Gasparyan, S., Sahakyan, N., Baghmanyan, V., & Zargaryan, D. 2018, ApJ, 863, 114 [NASA ADS] [CrossRef] [Google Scholar]
- Ghisellini, G. 2013, Radiative Processes in High Energy Astrophysics (Switzerland: Springer International Publishing), 873 [Google Scholar]
- Ghisellini, G., & Tavecchio, F. 2009, MNRAS, 397, 985 [NASA ADS] [CrossRef] [Google Scholar]
- Ghisellini, G., Maraschi, L., & Treves, A. 1985, A&A, 146, 204 [NASA ADS] [Google Scholar]
- Hardcastle, M. J., Birkinshaw, M., Cameron, R. A., et al. 2002, ApJ, 581, 948 [NASA ADS] [CrossRef] [Google Scholar]
- Harris, D. E., & Krawczynski, H. 2002, ApJ, 565, 244 [NASA ADS] [CrossRef] [Google Scholar]
- Harris, D. E., & Krawczynski, H. 2006, ARA&A, 44, 463 [NASA ADS] [CrossRef] [Google Scholar]
- Harris, J., Daniel, M. K., & Chadwick, P. M. 2012, ApJ, 761, 2 [NASA ADS] [CrossRef] [Google Scholar]
- Hayashida, M., Nalewajko, K., Madejski, G. M., et al. 2015, ApJ, 807, 79 [Google Scholar]
- Inoue, S., & Takahara, F. 1996, ApJ, 463, 555 [NASA ADS] [CrossRef] [Google Scholar]
- Jones, F. C., & Ellison, D. C. 1991, Space Sci. Rev., 58, 259 [NASA ADS] [CrossRef] [Google Scholar]
- Kataoka, J., & Stawarz, Ł. 2005, ApJ, 622, 797 [NASA ADS] [CrossRef] [Google Scholar]
- Kaur, N., & Baliyan, K. S. 2018, A&A, 617, A59 [NASA ADS] [CrossRef] [EDP Sciences] [Google Scholar]
- Keivani, A., Murase, K., Petropoulou, M., et al. 2018, ApJ, 864, 84 [NASA ADS] [CrossRef] [Google Scholar]
- Kirk, J. G., & Heavens, A. F. 1989, MNRAS, 239, 995 [NASA ADS] [Google Scholar]
- Kirk, J. G., Guthmann, A. W., Gallant, Y. A., & Achterberg, A. 2000, ApJ, 542, 235 [NASA ADS] [CrossRef] [Google Scholar]
- Kohler, S., & Nalewajko, K. 2015, MNRAS, 449, 2901 [NASA ADS] [CrossRef] [Google Scholar]
- Kusunose, M., & Takahara, F. 2017, ApJ, 835, 20 [NASA ADS] [CrossRef] [Google Scholar]
- Li, X., Mohan, P., An, T., et al. 2018, ApJ, 854, 17 [NASA ADS] [CrossRef] [Google Scholar]
- Liao, N. H., Xin, Y. L., Liang, Y. F., et al. 2018, ArXiv e-prints [arXiv:1807.05210] [Google Scholar]
- Liu, R.-Y., Wang, K., Xue, R., et al. 2019, Phys. Rev. D, 99, 063008 [NASA ADS] [CrossRef] [Google Scholar]
- Maraschi, L., Ghisellini, G., & Celotti, A. 1992, ApJ, 397, L5 [NASA ADS] [CrossRef] [Google Scholar]
- Meyer, E. T., & Georganopoulos, M. 2014, ApJ, 780, L27 [NASA ADS] [CrossRef] [Google Scholar]
- Meyer, E. T., Georganopoulos, M., Sparks, W. B., et al. 2015, ApJ, 805, 154 [NASA ADS] [CrossRef] [Google Scholar]
- Meyer, E. T., Breiding, P., Georganopoulos, M., et al. 2017, ApJ, 835, L35 [NASA ADS] [CrossRef] [Google Scholar]
- Meyer, M., Scargle, J. D., & Blandford, R. D. 2019, ApJ, 877, 39 [NASA ADS] [CrossRef] [Google Scholar]
- Murase, K., Oikonomou, F., & Petropoulou, M. 2018, ApJ, 865, 124 [NASA ADS] [CrossRef] [EDP Sciences] [Google Scholar]
- Nalewajko, K. 2013, MNRAS, 430, 1324 [NASA ADS] [CrossRef] [Google Scholar]
- Padovani, P., & Giommi, P. 1995, ApJ, 444, 567 [NASA ADS] [CrossRef] [Google Scholar]
- Paliya, V. S. 2015, ApJ, 808, L48 [NASA ADS] [CrossRef] [Google Scholar]
- Paliya, V. S., Sahayanathan, S., & Stalin, C. S. 2015, ApJ, 803, 15 [NASA ADS] [CrossRef] [Google Scholar]
- Pian, E., Falomo, R., & Treves, A. 2005, MNRAS, 361, 919 [NASA ADS] [CrossRef] [Google Scholar]
- Prince, R., Raman, G., Hahn, J., Gupta, N., & Majumdar, P. 2018, ApJ, 866, 16 [NASA ADS] [CrossRef] [Google Scholar]
- Rani, B., Lott, B., Krichbaum, T. P., Fuhrmann, L., & Zensus, J. A. 2013, A&A, 557, A71 [NASA ADS] [CrossRef] [EDP Sciences] [Google Scholar]
- Reimer, A. 2007, ApJ, 665, 1023 [NASA ADS] [CrossRef] [Google Scholar]
- Rieger, F. M., Bosch-Ramon, V., & Duffy, P. 2007, Ap&SS, 309, 119 [NASA ADS] [CrossRef] [Google Scholar]
- Sahakyan, N. 2018, ApJ, 866, 109 [NASA ADS] [CrossRef] [Google Scholar]
- Sahakyan, N. 2019, A&A, 622, A144 [NASA ADS] [CrossRef] [EDP Sciences] [Google Scholar]
- Sahakyan, N., & Gasparyan, S. 2017, MNRAS, 470, 2861 [NASA ADS] [CrossRef] [Google Scholar]
- Saito, S., Stawarz, Ł., Tanaka, Y. T., et al. 2013, ApJ, 766, L11 [NASA ADS] [CrossRef] [Google Scholar]
- Shukla, A., Mannheim, K., Patel, S. R., et al. 2018, ApJ, 854, L26 [NASA ADS] [CrossRef] [Google Scholar]
- Sikora, M., Begelman, M. C., & Rees, M. J. 1994, ApJ, 421, 153 [NASA ADS] [CrossRef] [Google Scholar]
- Stawarz, Ł., Sikora, M., Ostrowski, M., & Begelman, M. C. 2004, ApJ, 608, 95 [NASA ADS] [CrossRef] [Google Scholar]
- Summerlin, E. J., & Baring, M. G. 2012, ApJ, 745, 63 [NASA ADS] [CrossRef] [Google Scholar]
- Tavecchio, F., Maraschi, L., Sambruna, R. M., & Urry, C. M. 2000, ApJ, 544, L23 [NASA ADS] [CrossRef] [Google Scholar]
- Tavecchio, F., Becerra-Gonzalez, J., Ghisellini, G., et al. 2011, A&A, 534, A86 [NASA ADS] [CrossRef] [EDP Sciences] [Google Scholar]
- The Fermi-LAT Collaboration 2019, ApJS, submitted [arXiv:1902.10045] [Google Scholar]
- Urry, C. M., & Padovani, P. 1995, PASP, 107, 803 [NASA ADS] [CrossRef] [Google Scholar]
- Vanden Berk, D. E., Richards, G. T., Bauer, A., et al. 2001, AJ, 122, 549 [NASA ADS] [CrossRef] [Google Scholar]
- Wang, K., Liu, R.-Y., Li, Z., Wang, X.-Y., & Dai, Z.-G. 2018, ArXiv e-prints [arXiv:1809.00601] [Google Scholar]
- Xue, R., Liu, R. Y., Petropoulou, M., et al. 2019, ApJ, 886, 23 [NASA ADS] [CrossRef] [Google Scholar]
- Zacharias, M., Böttcher, M., Jankowsky, F., et al. 2017, ApJ, 851, 72 [NASA ADS] [CrossRef] [Google Scholar]
- Zacharias, M., Böttcher, M., Jankowsky, F., et al. 2019, ApJ, 871, 19 [NASA ADS] [CrossRef] [Google Scholar]
- Zamaninasab, M., Clausen-Brown, E., Savolainen, T., & Tchekhovskoy, A. 2014, Nature, 510, 126 [NASA ADS] [CrossRef] [PubMed] [Google Scholar]
- Zargaryan, D., Gasparyan, S., Baghmanyan, V., & Sahakyan, N. 2017, A&A, 608, A37 [NASA ADS] [CrossRef] [EDP Sciences] [Google Scholar]
All Tables
Parameters of fitting with PLEC model in the periods showing deviation from the power-law model.
All Figures
|
Fig. 1. Upper panel: γ-ray light curve of CTA 102 with 1-day time bins from 01 January 2016 to 01 April 2018. Lower panels: γ-ray spectra in the energy range from 100 MeV to 300 GeV for the periods that showed significant deviation from the simple power-law model. The power-law with exponential cut-off spectral model (dashed red line) with the fit uncertainties (red solid lines) are shown together with the spectral points and it is compared with other adopted models (broken power-law in blue and log parabola in black). The spectral points are obtained by separately running gtlike for smaller energy intervals. |
| In the text | |
|
Fig. 2. Left panel: internal BLR absorption as a function of distance for different γ-ray energies. The red dot-dashed line shows the RLyα radius. Right panel: reconstructed power-law model compared with the data considering external (EBL) and internal absorptions. The latter was computed assuming the emission region is at ∼50 rg (doted blue line) and at ∼1000 rg (dot-dashed blue line) distances from the central source. |
| In the text | |
|
Fig. 3. SED of CTA 102 for the period from MJD 57748 to MJD 57753. The archival data are shown in light gray. The models are shown assuming the emitting region is inside the BLR (left panel) and outside the BLR (right panel). Different models are noted in the plot legend and the model parameters are given in the text. |
| In the text | |
|
Fig. 4. Energy distribution of the electrons for the models presented in Fig. 3 obtained by MCMC modeling of the observed data. |
| In the text | |
Current usage metrics show cumulative count of Article Views (full-text article views including HTML views, PDF and ePub downloads, according to the available data) and Abstracts Views on Vision4Press platform.
Data correspond to usage on the plateform after 2015. The current usage metrics is available 48-96 hours after online publication and is updated daily on week days.
Initial download of the metrics may take a while.