Free Access
Fig. 3.
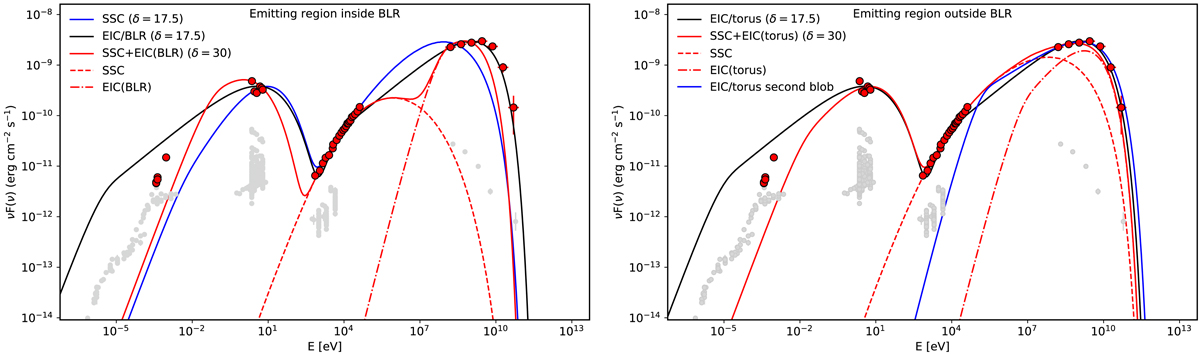
SED of CTA 102 for the period from MJD 57748 to MJD 57753. The archival data are shown in light gray. The models are shown assuming the emitting region is inside the BLR (left panel) and outside the BLR (right panel). Different models are noted in the plot legend and the model parameters are given in the text.
Current usage metrics show cumulative count of Article Views (full-text article views including HTML views, PDF and ePub downloads, according to the available data) and Abstracts Views on Vision4Press platform.
Data correspond to usage on the plateform after 2015. The current usage metrics is available 48-96 hours after online publication and is updated daily on week days.
Initial download of the metrics may take a while.