Fig. 1.
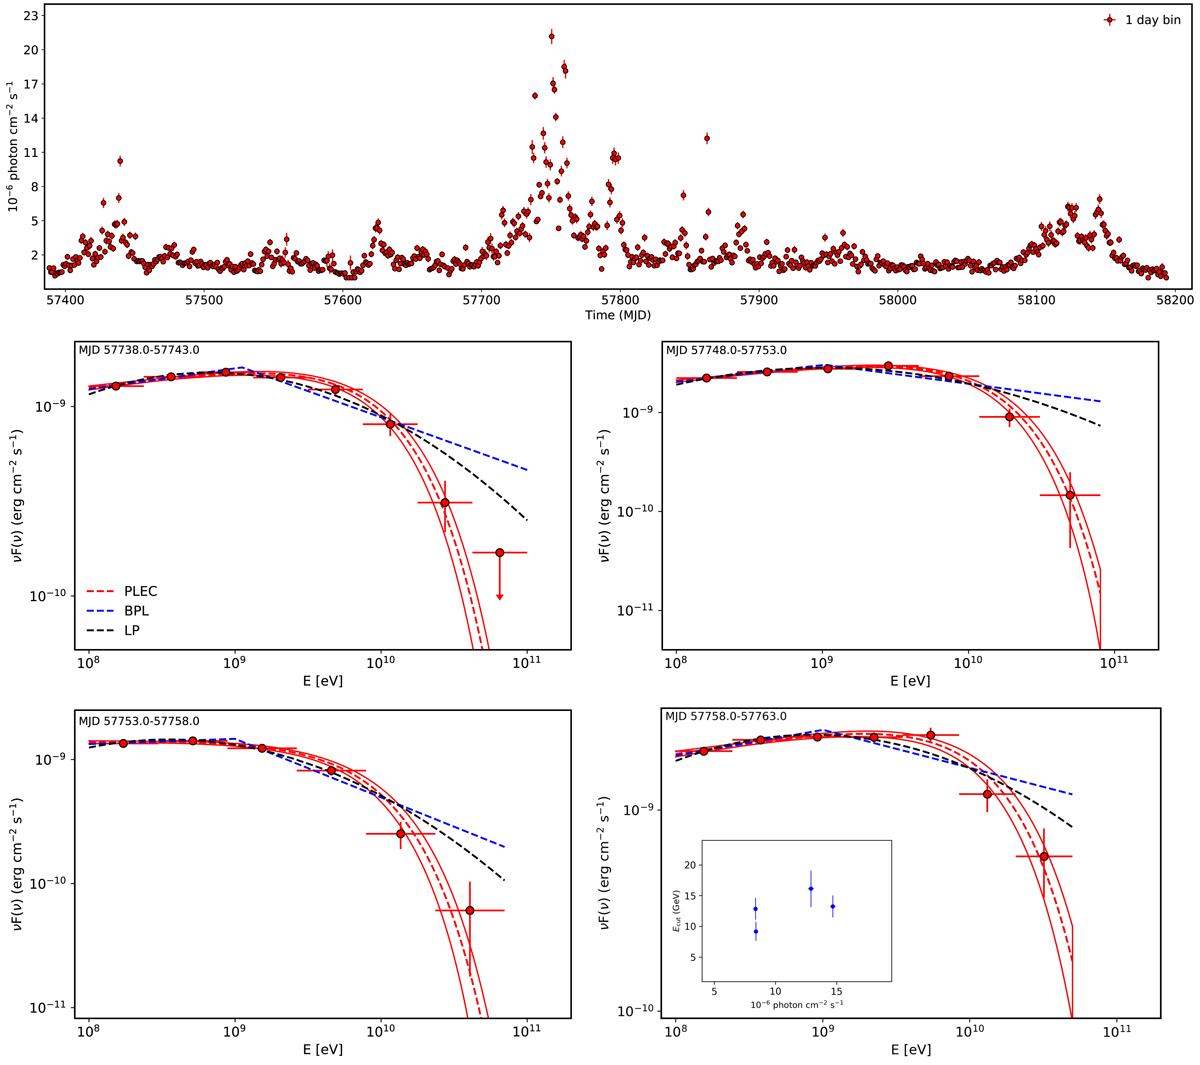
Upper panel: γ-ray light curve of CTA 102 with 1-day time bins from 01 January 2016 to 01 April 2018. Lower panels: γ-ray spectra in the energy range from 100 MeV to 300 GeV for the periods that showed significant deviation from the simple power-law model. The power-law with exponential cut-off spectral model (dashed red line) with the fit uncertainties (red solid lines) are shown together with the spectral points and it is compared with other adopted models (broken power-law in blue and log parabola in black). The spectral points are obtained by separately running gtlike for smaller energy intervals.
Current usage metrics show cumulative count of Article Views (full-text article views including HTML views, PDF and ePub downloads, according to the available data) and Abstracts Views on Vision4Press platform.
Data correspond to usage on the plateform after 2015. The current usage metrics is available 48-96 hours after online publication and is updated daily on week days.
Initial download of the metrics may take a while.