Fig. 2.
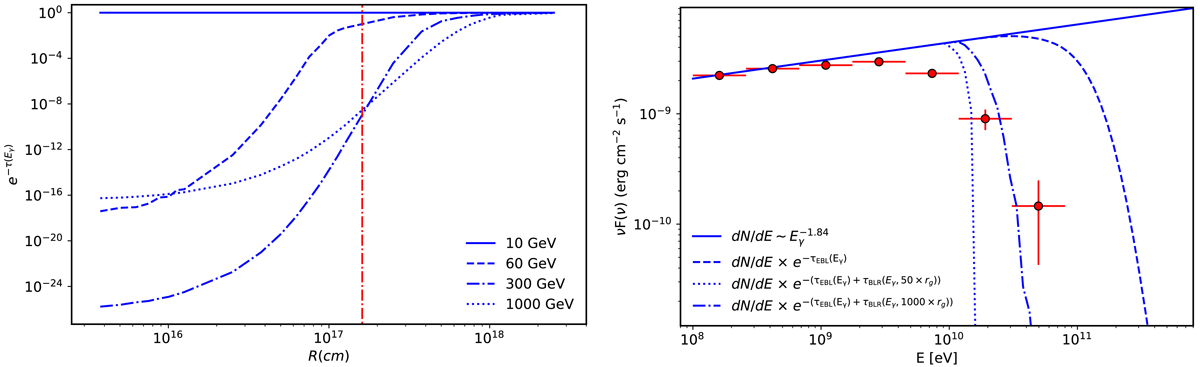
Left panel: internal BLR absorption as a function of distance for different γ-ray energies. The red dot-dashed line shows the RLyα radius. Right panel: reconstructed power-law model compared with the data considering external (EBL) and internal absorptions. The latter was computed assuming the emission region is at ∼50 rg (doted blue line) and at ∼1000 rg (dot-dashed blue line) distances from the central source.
Current usage metrics show cumulative count of Article Views (full-text article views including HTML views, PDF and ePub downloads, according to the available data) and Abstracts Views on Vision4Press platform.
Data correspond to usage on the plateform after 2015. The current usage metrics is available 48-96 hours after online publication and is updated daily on week days.
Initial download of the metrics may take a while.