| Issue |
A&A
Volume 635, March 2020
|
|
|---|---|---|
| Article Number | A187 | |
| Number of page(s) | 19 | |
| Section | Galactic structure, stellar clusters and populations | |
| DOI | https://doi.org/10.1051/0004-6361/201935903 | |
| Published online | 02 April 2020 | |
A VLT/FLAMES survey for massive binaries in Westerlund 1
VII. Cluster census⋆
1
School of Physical Sciences, The Open University, Walton Hall, Milton Keynes MK7 6AA, UK
e-mail: This email address is being protected from spambots. You need JavaScript enabled to view it.
2
Lockheed Martin Integrated Systems, Building 1500, Langstone, Hampshire PO9 1SA, UK
3
Departamento de Física Aplicada, Facultad de Ciencias, Universidad de Alicante, Carretera San Vicente s/n, 03690 San Vicente del Raspeig, Spain
Received:
16
May
2019
Accepted:
15
July
2019
Abstract
Context. The formation, properties, and evolution of massive stars remain subject to considerable theoretical and observational uncertainty. This impacts on fields as diverse as galactic feedback, the production of cosmic rays, and the nature of the progenitors of both electromagnetic and gravitational wave transients.
Aims. The young massive clusters many such stars reside within provide a unique laboratory for addressing these issues. In this work we provide a comprehensive stellar census of Westerlund 1 in order to to underpin such efforts.
Methods. We employed optical spectroscopy of a large sample of early-type stars to determine cluster membership for photometrically-identified candidates, characterise their spectral type, and identify new candidate spectroscopic binaries.
Results. Sixty nine new members of Westerlund 1 are identified via I-band spectroscopy. Together with previous observations, they illustrate a smooth and continuous morphological sequence from late-O giant through to OB supergiant. Subsequently, the progression bifurcates, with one branch yielding mid-B to late-F hypergiants, and cool supergiants, and the other massive blue stragglers prior to a diverse population of H-depleted WRs. We identify a substantial population of O-type stars with very broad Paschen series lines, a morphology that is directly comparable to known binaries in the cluster. In a few cases additional low-resolution R-band spectroscopy is available, revealing double-lined He I profiles and confirming binarity for these objects; suggesting a correspondingly high binary fraction amongst relatively unevolved cluster members.
Conclusions. Our current census remains incomplete, but indicates that Westerlund 1 contains at least 166 stars with initial masses estimated to lie between ∼25 M⊙ and ∼50 M⊙, with more massive stars already lost to supernova. Our data is consistent with the cluster being co-eval, although binary interaction is clearly required to yield the observed stellar population, which is characterised by a uniquely rich cohort of hypergiants ranging from spectral type O to F, with both mass-stripped primaries and rejuvenated secondaries or merger products present. Future observations of Wd1 and similar stellar aggregates hold out the prospect of characterising both single- and binary- evolutionary channels for massive stars and determining their relative contributions. This in turn will permit the physical properties of such objects at the point of core-collapse to be predicted, which is of direct relevance for understanding the formation of relativistic remnants such as the magnetars associated with Wd1 and other young massive clusters.
Key words: stars: early-type / stars: evolution / open clusters and associations: individual: Westerlund 1
This work is based on observations collected at the European Southern Observatory, Paranal Observatory under programme IDs ESO 081.D-0324, 383.D-0633, 087.D-0440 and 091.D-0179.
© ESO 2020
1. Introduction
Even before the detection of gravitational waves from coalescing neutron stars and black holes, the case for fully understanding the evolutionary cycle of massive stars was compelling. They, and their explosive endpoints contribute to the secular evolution of galaxies via radiative and mechanical feedback, the deposition of dust, and the products of nuclear burning into the wider interstellar medium, facilitating subsequent generations of star formation. Upon core-collapse, they yield a rich variety of energetic electromagnetic transients, with their relativistic remnants subsequently forming both X- and γ-ray binaries; phenomena that have also been associated with the production of cosmic rays.
Rich young stellar clusters and associations potentially serve as powerful laboratories for investigating the properties and the lifecycle of massive stars, as illustrated by Massey et al. (2000, 2001). Modern multiplexing spectroscopic instruments match the scale of such aggregates, meaning stellar populations can be efficiently categorised and, as a consequence, evolutionary models observationally tested. Moreover, observations of multiple clusters at different ages means that we can reconstruct the evolutionary pathways of stars sampling a wide range of initial masses.
The efficacy of this methodology is evidenced by the investigation of the 30 Dor star formation region initiated by Evans et al. (2011). However, as part of this multi-work campaign, Schneider et al. (2018) reveal a potential impediment to this approach; specifically 30 Dor is found to have a complex, extended formation history resulting in multiple spatially unsegregated stellar populations. Such a situation complicates the interpretation of evolutionary sequences, which are better constrained in simple, co-eval stellar populations. Moreover, at a distance of ∼50 kpc essential observational diagnostics – such as long wavelength continuum observations to constrain mass loss rates – are difficult to apply.
Consequently, the identification of such stellar aggregates within the Galaxy would be of considerable value. As potentially the most massive open cluster within the Galaxy, Westerlund 1 (henceforth Wd1; Westerlund 1961, 1987) is a compelling target and, although heavily reddened, it remains accessible in the R- and I-bands. With an age of ∼5 Myr, it hosts a unique population of cool hypergiants in addition to significant numbers of OB supergiants, Wolf–Rayet (WR) stars, and the magnetar CXO J164710.2−455216 (Clark et al. 2005; Crowther et al. 2006a; Muno et al. 2006a; Negueruela et al. 2010; Kudryavtseva et al. 2012).
Westerlund 1 is spectacular in appearance across the electromagnetic spectrum, with point source (stellar) and diffuse emission observed at:
– X-ray energies due to emission from the magnetar, shocks in the winds of single stars, the wind collision zones of massive binaries, (unresolved) pre-main sequence low-mass stars and the hot intracluster medium (Clark et al. 2008, 2019c; Muno et al. 2006b). Spatially extended, highly energetic γ-rays (GeV and TeV; Ohm et al. 2013 and Abramowski et al. 2012, respectively) have also been associated with Wd1 and as a consequence it has also been implicated in the production of cosmic rays. Both phenomena have been attributed to the (interactions between the) winds of massive single and binary stars, the cluster wind and supernovae (e.g. Aharonian et al. 2019; Bednarek et al. 2014; Bykov et al. 2015; Cesarsky & Montmerle 1983).
– IR emission is due to warm dust associated with interacting O-star and WR binaries and the ejection nebulae of cool super-/hypergiants, which is subsequently entrained within the intracluster medium (Clark et al. 1998, 2013; Crowther et al. 2006a; Dougherty et al. 2010).
– mm- and radio-continuum emission is attributed to stellar winds from early-type and WR stars, circumstellar ejecta associated with the cool stellar cohort, wind collision zones in interacting binaries and the ionised intracluster medium (Dougherty et al. 2010; Fenech et al. 2017, 2018; Andrews et al. 2018).
These phenomena are all ultimately driven by the underlying massive stellar population of the cluster in both life and death; hence if we are to understand them we are required to construct an accurate stellar census for Wd1. Since many are also manifestations of binary interaction, any such efforts should also serve to constrain the nature of this population, noting that multi-wavelength (X-ray, IR and radio) and multi-epoch photometric observations imply a high binary fraction (Clark et al. 2019c; Crowther et al. 2006a; Dougherty et al. 2010; Bonanos 2007, respectively). Such a rigorously determined population census is also essential in order to constrain the bulk properties of the cluster such as age, mass, initial mass function, degree of mass segregation, dynamical state and mode of formation (e.g. Andersen et al. 2017; Brandner et al. 2008; Cottaar et al. 2012; Gennaro et al. 2011, 2017; Kudryavtseva et al. 2012; Lim et al. 2013; Negueruela et al. 2010).
Consequently between 2008 and 2013 we undertook a large multi-epoch I-band spectroscopic survey of massive stars within Wd1 with the Fibre Large Array Multi Element Spectrograph (FLAMES; Pasquani et al. 2002) mounted on the Very Large Telescope (VLT). These observations were designed to (i) constrain the binary population of Wd1 via radial velocity (RV) monitoring, (ii) provide an expanded stellar census encompassing the fainter cohort of massive evolved stars and (iii) supplement extant spectroscopic and photometric data in order to permit quantitative model atmosphere analysis of individual cluster members. To date these observations have allowed us to investigate the incidence of binarity amongst the supergiants (Ritchie et al. 2009a, 2011), provide tailored analyses of a number of interacting and post-interaction systems (Clark 2011; Clark et al. 2014b, 2019a; Ritchie et al. 2010) and relate the X-ray properties of cluster members to their underlying stellar properties (Clark et al. 2019c). In this work we present an enlarged census for Wd1, comprising 166 massive evolved stars, and discuss the implications of this population for both single- and binary-star evolutionary channels, and the nature of the cluster – both in isolation and in comparison to other young massive stellar aggregates.
2. Observations and data reduction
As described above the original, and primary, science goal of our programme was the identification and characterisation of massive binaries within Wd1. In order to accomplish this multiple observations of four target fields were made in service mode during 2008 and 2009 using the FLAMES-GIRAFFE multi-fibre spectrograph with setup HR21 to cover the 8484–9001 Å range with R = λ/Δλ ∼ 16 200. These comprised a bright field, containing 22 spectroscopically- and photometrically-selected targets (detailed in Ritchie et al. 2009a) and three faint fields containing 17 spectroscopically-confirmed cluster members and 63 photometrically-selected candidates. With three exceptions – Wd1-57a, Wd-71 and WR K – the faint lists contain only stars with previously-known spectral types no later than B0 Iab, or photometry consistent with lower-luminosity O9-B0 stars just evolving towards the supergiant phase (cf. Fig. 1). Integration times were typically 2 × 600 s for the bright and 3 × 895 s for the three faint configurations. Given the appearance of some targets in more than one configuration – motivated by the desire to maximise fibre allocation – and the differing frequency with which each configuration was executed, individual stars were ordinarily observed between five and eleven times.
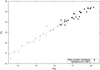 |
Fig. 1. Comparison of R- and I-band photometric magnitudes from Clark et al. (2005) for cluster members listed by Westerlund (1987; open squares) and new confirmed cluster members listed in Table A.1 (solid squares). |
Subsequently, additional observations were made in 2011 and 2013 utilising the same configuration. Target selection was optimised to include (i) follow up of spectroscopically and/or photometrically identified binary candidates and (ii) initial observations of previously unclassified luminous candidate cluster members and/or X-ray bright stars. Due to the observing runs remaining incomplete and the constraints imposed by fibre allocation, the final number of observations (and hence integration time) for individual stars varies considerably; a full observing log will be provided in Clark et al. (in prep.) where we analyse the full RV dataset.
The FLAMES-GIRAFFE pipeline and Common Pipeline Library were used to bias subtract, flat field and wavelength calibrate the data, while subsequent processing made use of IRAF1 for the extraction individual spectra, rectification and heliocentric velocity correction; full details of data reduction are given in Ritchie et al. (2009a).
Fortuitously, R-band spectra of a number of our targets were acquired on the nights of 12 and 13 June 2004 using VLT/FORS2 in longslit and mask exchange unit (MXU) modes, and are used to supplement the limited wavelength coverage of these targets provided by our single VLT/FLAMES setup. The G1200R grism was employed, yielding a nominal dispersion of 0.38 Å pixel−1 over the spectral range 5750–7310 Å. A 0.3″ slit was utilised for the longslit mode to obtain a resolution of ∼7000. For the MXU mode we employed 1″ slits; these observations had a resolving power of ∼2200, with the exact wavelength coverage dependant on the position on the CCD. Data reduction for these objects is as described in Negueruela et al. (2010).
Finally additional spectra in the outskirts of Wd1 were obtained with the fibre-fed dual-beam AAOmega spectrograph on the 3.9 m Anglo-Australian Telescope (AAT) at the Australian Astronomical Observatory on 2011, July 21. The Two Degree Field (“2dF”) multi-object system was utilised. Light from an optical fibre of diameter  on the sky is fed into two arms via a dichroic beam-splitter with crossover at 5700 Å. Each arm of the AAOmega system is equipped with a 2k × 4k E2V CCD detector and an AAO2 CCD controller. Given the very high reddening to the targets, the blue arm did not produce useful spectra. The red arm used the 1700D grating, providing a resolution R ∼ 11 000 in the region surrounding the Ca II triplet. The spectra cover a 500 Å wide range centred on 8700 Å, but the projection of the spectrum from each fibre on the CCD depends on its position on the plate, displacing the range limits up to ∼20 Å. The exposure time was 1200 s. Data reduction was subsequently carried out in the manner described in González-Ferández et al. (2015).
3. New cluster members
We are able to identify a total of 69 new cluster members via our spectroscopy. Foreshadowing Sects. 3.1–3.5, the resultant stellar census for Wd1 is summarised in Table 1, while the co-ordinates, photometry and spectral classifications for individual members are presented in Table A.1. Once ordered by increasing right ascension, we apply a W1xxx designation for these new sources2.
Stellar demographics of Wd1.
In addition to these stars, eight further objects were observed. Seven of these eight targets were found to be late-type stars3, while the final object is a B-type star of luminosity class V. The RVs measured for the majority of these indicate that they are foreground objects, but two objects, F7 and F8, have RVs consistent with membership of Wd1 (Clark et al. 2014b, and in prep.). However, the pronounced DIB at ∼8620 Å that is characteristic of bona fide cluster members (cf. Sect. 3.1) appears weak or absent for both stars, which are also spatial outliers to the east and north of the cluster respectively. Given their apparent classification as mid-K giants we conclude that these are also interlopers (Table 2).
Field stars.
3.1. Spectroscopic classification
Co-added spectra of (apparently) non-binary objects are used as standards for classification of the newly-identified stars in Wd1, with an appropriate I-band stellar sequence shown in Figs. 2 and 3. Following guidelines to classifying O9–B9 stars, taken from Clark et al. (2005), Negueruela et al. (2010), the following diagnostics are used:
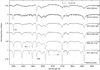 |
Fig. 2. Montage of I-band spectra of classification standards for apparently single stars of spectral type O9-B2.5. The spectrum of the 3.18-day eclipsing binary Wd1-36 is included to indicate the appearance of SB2 systems of comparable spectral type within Wd1; note the shallow, flat-bottomed Paschen series lines (see Sect. 3.5). |
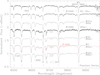 |
Fig. 3. New I-band spectra of W1049 and W1069 plotted against a montage of cluster B0-B9 hypergiants in order to permit classification (with the highly luminous B4 Ia star Wd1-57a included for completeness). The spectrum of W1069 has been degraded in resolution (red dashed line) to enable direct comparison to the spectra of B5-9 hypergiants. |
– The comparative weakness of the higher Paschen lines and the strength of C III 8500 Å leads to a ratio (Pa-16+C III 8500 Å)/Pa-15≫1 for O-type stars. At O9 the Pa-15 line is hard to distinguish from the continuum.
– At B0, Pa-15 and Pa-16 lines are of approximately equal strength due to the increasing contribution of C III 8500 Å to the Pa-16 line. He I 8583 Å is still clear, while He I 8847 Å is seen as an inflection on the blue wing of Pa-11.
– B0.5-2 spectral types show a rapid increase in the strength of both the Paschen series and the He I lines (Negueruela et al. 2010), with all objects later than B0 showing Pa-15/Pa-16 > 1. A wealth of N I lines between ∼8680 and 8730 Å begin to appear at ∼B2 and are clear by B2.54.
– For spectral types B2.5 and later both the Paschen series and N I photospheric lines continue to increase in strength, while the He I lines drop out by ∼B5. At the same point, comparison of the strength of the emerging Ca II 8498.0 Å, 8542.1 Å and 8662.1 Å absorption features to their adjacent Paschen series lines allows spectral types to ∼B9 to be distinguished.
With our limited spectral coverage and paucity of lines suitable for classification, distinguishing between O9 and O9.5 is challenging. At high S/N He I 8583 Å remains visible at O9.5, but generally cannot be distinguished at the lower S/N of many faint targets, and C III 8500 Å line strength represents the best available classifier, while the width and profile of the wings of Pa-11 serve as a guide to the luminosity class. However, as discussed in Negueruela et al. (2010), these features will also be affected by rotation and abundance anomalies, and classifications given here are therefore uncertain to ∼half a spectral type.
A further potential difficulty in classifying O-type stars is introduced by binarity. The brevity of (post-MS) evolutionary phases means that a system containing a luminous supergiant primary will appear single-lined unless the mass ratio is near unity – such that both objects are in a comparable state – and will therefore display a spectrum that is very similar to that of a single star. However systems that consist of an ∼O9-9.5 III primary and massive OB secondary are more likely to display composite spectra. Consideration of synthetic spectra suggests that the relatively broad Paschen series lines in a short-period O9 III+O9 III system would remain heavily blended even at quadrature. We might therefore expect such systems to display a spectrum with broad, flat-bottomed Paschen series lines and anomalously broad, weak C III 8500Å that would prove difficult to classify. An exampler of this phenomenon, albeit of greater luminosity, is the 3.18-day eclipsing binary Wd1-36 (Bonanos 2007); as a consequence of the strong line-blending we are only able to prove a generic OB Ia + OB Ia classification for this system. This also serves to illustrate the significant morphological differences between the spectra of such systems and those of stars following the empirical O9 III – B2.5 Ia evolutionary sequence illustrated by Fig. 2; we discuss this and similar systems in greater detail in Sect. 3.5.
A number of interstellar features are also visible in our spectra. The strong, well-defined ∼8620 Å DIB has been discussed in Ritchie et al. (2009a), and serves as a check for zero-point RV errors in our data; in 18 observations of the luminous B2.5 Ia supergiant Wd1-71, we find σRV(8620) = 0.76 km s−1 and variations in FWHM of less than 2%. A broad DIB at ∼8648 Å is also apparent (see also Negueruela et al. 2010 and references therein) and a DIB at 8529 Å is also seen in high-S/N spectra. A number of weaker interstellar features are also present, with the C2 Phillips (2–0) band system (e.g. van Dishoeck & de Zeeuw 1984) prominent on the red wing of the Pa-12 line. The R lines largely overlap the core of Pa-12 and cannot be measured with accuracy, but in very high S/N co-added spectra of Wd1-71 (total integration time ∼9 h) the Q lines are very strong and may be distinguished to Q(18), while a strong R(0) line, moderate P(2) and P(8) lines and weak R(10), R(12) may also be distinguished, with P(4) and P(6) blended with the wings of He I 8777 Å. The mean radial velocity of the eleven lines that could be measured with accuracy, weighted by equivalent width, is −44.7 ± 1.9 km s−1, very close to typical systemic velocities for the stellar population of Wd1, suggesting that the absorbing material is local to the cluster. The centre of the strong ∼8620 Å DIB lies at 8619.8 Å; if this is assumed to originate in the same material as the Phillips (2–0) system then the intrinsic DIB wavelength is in good agreement with the value of 8621.2 Å reported by Jenniskens & Desert (1994).
3.2. Blue hypergiants
We turn first to W1049 and W1069; two new reddened hypergiant candidates identified via our AAT observations (Figs. 3 and 4). W1069 has only been observed in the I-band, but it appears to be an excellent match to the B5 Ia+ cluster members Wd1-7 and -33; the strength of the Ca II lines precluding an earlier (≤B4; Wd1-57a) or later (∼B9; Wd1-42a) spectral type. By contrast the I-band spectrum of W1049 appears earlier, matching that of both the apparently single B1.5 Ia supergiant Wd1-8b (Fig. 2) and Wd1-5 (WN10-11h/B0.5 Ia+; Crowther et al. 2006a; Negueruela et al. 2010).
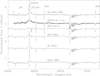 |
Fig. 4. R-band spectrum of W1049 plotted with comparable spectra of highly luminous cluster super-/hypergiants of spectral type B0-B9. |
Unlike W1069 an R-band spectrum is available and, as with Wd1-5, W1049 appears to differ from the normal supergiants within Wd1 (Fig. 4). Specifically both the strength and profile of the Hα line is atypical for such stars, while weak emission in the C II 6582 Å and N II 6611 Å lines is also anomalous (Negueruela et al. 2010). Instead these features characterise the B0-1 Ia+/WN10-11h stars Wd1-5 and -13, while the Hα profile – comprising a strong, narrow central peak and broad wings – is also reminiscent of these stars and, indeed, the B5 Ia+ stars Wd1-7 and -33 (Fig. 4 and Ritchie et al. 2010). A similar Hα profile is observed for Cyg OB2 #12 (B3-4 Ia+) and ζ1 Sco (B1.5 Ia+); albeit with the C II lines in absorption in both stars and a prominent P Cygni component characterising the latter star (such that it resembles the much cooler Wd1-42a; Clark et al. 2012).
The corresponence between W1049, Wd1-5, and -13 is not exact, with P Cygni profiles of the He I 6678 Å and 7065 Å lines in the latter stars absent in the former. Nevertheless their overal similarity provides a compelling case for a hypergiant classification for W1049. This is particularly interesting since both Wd1-5 and -13 appear to result from binary driven mass-stripping (Ritchie et al. 2010; Clark et al. 2014b); to date no search for binarity has been undertaken for W1049.
3.3. Lower luminosity B stars
Nine of the newly classified cluster members present spectra consistent with early-B supergiants. Only two stars appear to have spectral types later than B0; W1039 and W1048 resemble Wd1-78 (B1 Ia; Negueruela et al. 2010) and Wd1-8b (B1.5 Ia; Fig. 2) respectively, and hence we adopt such classifications for them. The other seven objects – W1005, -1009, -1053, -1055, -1065, -1067, and -1068 – all appear to be B0 supergiants of luminosity class Iab or Ib. Of these W1068 shows discrepant Ca II and Mg I lines that are most probably due to blending with a foreground late-type star. W1055 is of note since it presents anomalously strong C III 8500 Å absorption and a broadening of the Paschen series lines at some epochs that suggests the presence of an O-type companion (Clark et al., in prep.), W1065 was likewise identified as a short-period RV-variable binary in Ritchie et al. (2011); strongly infilled Hα and C II 7231 Å and 7236 Å emission confirming a luminous supergiant classification (Negueruela et al. 2010). As such these add to other known early B supergiant binaries such as Wd1-6a and -52 (Bonanos 2007), Wd1-10 (Clark et al. 2019c), and Wd1-43a (Ritchie et al. 2011).
Critically, we find no B-type stars from lower luminosity classes – such as B2 Ib-II or B0.5-1 II-III stars that would correspond to an older population of Minit ∼ 15−20 M⊙ – which would present as anomalously photometrically faint objects with broad but sharp troughed Paschen series absorption profiles.
However, a tenth early-type star, W1004, displays Pa-11...16 lines in emission with double peaks characteristic of a classical OeBe star. Unfortunately, contamination of the sparse diagnostic features by emission from the circumstellar disc prevents accurate classification of the star and hence a precise evaluation of its evolutionary state. Irrespective of this shortcoming, despite a location 2′40″ to the south-west (3.7(d/5 kpc) pc in projection) the strong ∼8620 Å and ∼8648 Å DIBs in the spectrum of W1004 have profiles that are identical to OB stars in Wd1. Wisniewski & Bjorkman (2006) suggest an onset of the Be phenomenon around ∼5 Myr while, at solar metalicities, a handful of Oe stars have been identified (Negueruela et al. 2004; Vink et al. 2009). As a consequence we consider that W1004 is potentially a member of Wd1 and one that could derive from the underlying co-eval cluster population defined by the stars reported here.
3.4. O stars
Finally we turn to the majority of the new cluster members which, pre-empting the following discussion, we find to be O-type stars of luminosity class III-Ib. Given the limitations of the spectroscopic diagnostics present in the I-band we need to make explicit use of extant photometry and, where available, R-band spectroscopy in order to obtain the most precise classifications for this cohort. Despite the possibility of a systematic offset in the classifications we arrive at in comparison to those obtained from more traditional methodologies (e.g. employing blue-end spectral diagnostics) we are confident our technique robustly classifies such stars relative to other cluster members. Indeed it reinforces a central empirical finding of our survey; that there is a smooth and continuous progression in spectral morphologies from the earliest O giants through to the mid-B supergiants and indeed the mid- to late-B hypergiants (cf. Figs. 2 and 3).
Nevertheless, while further spectroscopic and photometric observations of the newly-identified cluster members are required to fully categorise this population, in general the new cluster members fall into four distinct groups:
-
Stars with spectra and photometry comparable to Wd1-1 and -74 (O9.5 Iab; Negueruela et al. 2010). As a result these are given an identical classification.
-
Stars with spectra similar to Wd1-74, but with slightly broader Paschen series lines and (when photometry is available) I-band magnitudes roughly a magnitude fainter than the B0 supergiants listed in Table A.1. These objects are classified as O9.5 II.
-
Stars with broader, weaker Paschen series lines than the O9.5 II stars, often with strong C III. In the few cases where photometry is available, these objects are 2–3 mag fainter than O9.5-B0 supergiants. These objects are classified as O9-9.5 III. Comparison with synthetic spectra generated with the non-LTE model atmosphere code CMFGEN (Hillier & Miller 1998) suggests that such a classification is generally reasonable, with non-tailored fits at 30 kK (O9.5) and 32 kK (O9) shown in Fig. 5.
-
Stars with very broad, weak Paschen series lines that are generally flat-bottomed. C III is also weak and broad. R-band spectra, when available, show shallow and possibly double-lined He I and infilled Hα, while the objects may be unexpectedly luminous for the implied early spectral type. These objects have very similar I-band morphologies to known binaries in Wd1 and are described in more detail in Sect. 3.5.
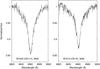 |
Fig. 5. Comparison of the Pa11 line from W1045 (O9.5 II, left panel) and W1015 (O9 III, right panel) to synthetic model atmosphere spectra for 30 kK and 32 kK respectively. Note the influence of He I 8839Å on the blue wing of W1045, which is not well reproduced by the non-tailored fit used. |
3.4.1. O9-9.5 supergiants
Seven stars5 appear to be bona fide late-O supergiants on the basis of their I-band spectra; we therefore adopt classifications of O9.5Iab for these objects (Table A.1). W1036 has a R-band spectrum (Fig. 6) which, demonstrating strong, narrow Hα and He I photospheric absorption, is entirely consistent with this conclusion.
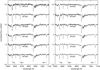 |
Fig. 6. Montage of select FORS2/MXU R-band spectra of newly-identified cluster members. Objects marked with a “*” show very broad Paschen series lines indicative of a SB2. |
However, a number of cluster members do not fit neatly into this scheme. W1057 would also be classified as O9.5 Iab on the basis of its I-band spectrum. However it is one of the more luminous O-type stars in our sample, with an R-band spectrum showing infilled Hα and weak wind lines of C II (Fig. 6); the combination of these properties suggest that it could instead be a rapidly-rotating B0 Iab supergiant. As such we adopt a classification of O9.5-B0 Iab for W1057, noting that other O9.5Iab stars, such as W1024 and -1034, are similarly luminous (although no R-band data are available for them). The spectra of W1033 and W1040 (=C07-X5 and C07-X3 respectively; Clark et al. 2008, 2019c) are hard to interpret, with Paschen series lines that suggest a classification of O9 III, but weak C III suggesting a later O9.5 (or possibly B0) spectral type and photometric magnitudes that are consistent with supergiants in Wd1. Low-resolution R-band spectroscopy of W1040, showing infilled Hα (Fig. 6), again supports a supergiant identification. We therefore assign an intermediate classification of O9-9.5 I-III for both stars. Finally W1041 is classified as O9.5Iab but presents anomalously broad Paschen lines; we discuss this further in Sect. 3.5.
3.4.2. O9.5 II stars
Nine cluster members6 are classified as O9.5 II due to their spectroscopic similarity to Wd1-74 (O9.5 Iab), with the important diagnostic exceptions of broader wings to the Paschen series lines – indicative of a higher surface gravity – and I-band magnitudes that are somewhat lower than the O9.5 Iab supergiants. Low-resolution FORS2/MXU R-band spectra are available for W1022, -1047 and -1050 (Fig. 6), all of which are consistent with such a classification, demonstrating narrow single-lined photospheric He I lines with Hα in absorption.
W1043 is photometrically fainter than this sample, with Paschen series lines that also appear slightly broader; as such we assign a provisional classification of O9.5 II-III. An R-band spectrum is available (Fig. 6); He I absorption lines are comparable to other O9.5 II stars, although Hα appears somewhat broader and infilled. W1002 also has a luminosity similar to the O9.5 II systems discussed above but displays very broad, dilute Paschen series lines that are morphologically similar to known binaries in Wd1; given this we suspect this system may contain an O9-9.5 II primary and an O-type secondary, which we discuss further in Sect. 3.5.
Finally, Bonanos (2007) reported that both W1002 and -1022 display rapid (P < 0.2 day), periodic photometric variations and, in the absence of spectroscopy, suggested that both are δ Scuti variables. However our spectral classifictions are clearly inconsistent with such a suggestion and are also earlier than expected for β Cephei-type variables (cf. Pamyatnykh 1999).
3.4.3. O9-9.5 III stars
After accounting for the above stars, 35 cluster members remain to be classified. Of these 12 stars7 fulfill the preceding observational criteria for classification as O9-9.5 III stars (cf. W1015; Figs. 2 and 5). Unfortunately no R-band spectra are available for any of these objects. A further 13 stars8 have spectra and, where available, photometry consistent with an O9-9.5 III classification – which we adopt – albeit with notably broader photospheric Paschen series lines. We discuss these stars as well as (i) the handful of more luminous stars previous highlighted as showing the same phenomenon9 and (ii) ten further, but more extreme examples10 – which, as a consequence defy precise determination of spectral type and/or luminosity class (cf. Tables 1 and A.1) – immediately below.
3.5. Broad-lined O-type stars
While the spectral sequence shown in Figs. 2 and 3 provides a good general template for classification, many of the faintest objects display a distinct I-band morphology, with weak, very broad, and flat bottomed Pa-11 and Pa-12 lines, almost no trace of Pa-13...15, and broad, weak C III 8500 Å (cf. Wd1-36; Fig. 2). The anomalous nature of this population can be seen in Fig. 7, which plots the width of the Pa-11 line against I-band magnitude for objects with photometry from Clark et al. (2005). Cluster members show a linear increase in the width of the Pa-11 line towards lower luminosity classes, but many of the faintest objects display substantially broader lines than this progression would suggest. In Fig. 8 we plot two representative examples of the broad lined population – W1020 and -1046 – against the O9 III classification standard W1015, the binary systems Wd1-36 and -53 (P ∼ 3.18 d and ∼1.3 d respectively; Bonanos 2007) and the post-binary interaction massive blue straggler Wd1-30a (O4-5Ia+; Clark et al. 2019a). It is clear from these data that the broad Paschen series lines of W1020 and -1046 are not a good match to the sharp bottomed photospheric profiles of W1015 and Wd1-30a (where the spectrum of the later is dominated by the early hypergiant component).
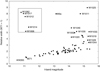 |
Fig. 7. Relative Pa-11 line width as a function of I-band luminosity for targets with photometry from Clark et al. (2005). For clarity, the box in the top left of this figure presents an expanded view of the points within the small dotted region. |
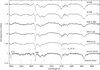 |
Fig. 8. Comparison the I-band spectra of known and newly-identified candidate binaries with the O9 III star W1015. Wd1-30a is a strong X-ray source indicative of a colliding-wind binary, while Wd1-53 displays a 1.3-day periodic modulation in its light curve and double He I lines, and Wd1-36 is a 3.18-day eclipsing binary. |
Instead, given the strong morphological similarities that exist between W1020 and -1046 and the binaries Wd1-36 and -53, we suggest that many, if not all, of the observed broad-lined systems are SB2 binaries, with a composite spectrum that includes contributions from a ∼O9 III primary and OB III-V secondary. Support for this conjecture is provided by:
– The additional presence of comparable I-band spectral morphologies in the photometrically identified binaries Wd1-6a (Fig. 7) and W1021 (P ∼ 2.20 d and ∼4.43 d respectively; Bonanos 2007); four such broad-lined systems are thus unambiguously binary.
– Despite our I-band observations being poorly-suited to detecting radial velocity changes in such broad-lined systems (Sect. 3.1), three stars – W1028, -1032, and -1061 – show radial velocity shifts indicative of reflex binary motion (σrv ∼ 10−20 km s−1; Clark et al., in prep.).
– The appearance of anomalously broad and/or double troughed profiles in the photospheric Hα and He I 6678 Å and 7065 Å lines in our low-resolution FORS2/MXU spectroscopy (Fig. 6). Specifically W1046 clearly shows a double-lined He I 7065 Å profile, while W1014, W1028, W1032 and W1044 all present Hα and He I lines that are broad and shallow compared to both (apparently) single stars (e.g. W1036; O9.5 Ib) and binaries in which the primary is substantially more luminous than the secondary and hence dominates the spectrum (e.g. W1065; B0 Ib).
As a consequence we provisionally apply generic classifications of O9-9.5III bin? and O+O? to those stars itemised in footnotes 8 and 10, respectively. The more luminous binaries Wd1-36 and -53a are likewise assigned an OB+OB classification while, as described previously, more precise classifications are possible for W1002, -1040, -1041 and -1055 (Table A.1).
If this distinctive I-band morphology is indeed indicative of binarity then the implied binary fraction amongst the late-O population in Wd1 appears substantial. However, considerable caution must be exercised before accepting this assertion. An obvious selection effect that must be allowed for is that binaries with an appreciable contribution from a massive secondary will be more luminous than an equivalent isolated star, and hence more likely to meet our photometric criteria for selection. Moreover in a subset of cases the broad-lined morphology might reflect rapid rotation rather than binarity. As a consequence, confirming the binary nature of the majority of these broad-lined systems is clearly a priority. Unfortunately this is technically challenging since it will require high-resolution observations targeting the He I 6678 Å and 7065 Å photospheric lines, as the reddening towards Wd1 precludes use of metal lines further bluewards. However the throughput with the appropriate VLT/FLAMES configuration yields spectra of insufficient S/N to accomplish this goal in a reasonable timeframe (cf. Clark et al., in prep.).
4. Discussion
Our new observations yield a total of 69 new cluster members for Wd1, bring the total census to 166 massive evolved stars. Understandably, given the fainter nature of the majority of targets (Fig. 1), we find that they are predominantly biased towards less evolved O stars of lower luminosity than the cluster OB supergiants previously classified (Table 1). We highlight that spectral classification for all objects has been uniformly accomplished via a combination I-band and optical photometry, supplemented with R-band spectroscopy where available (Sect. 3 and Negueruela et al. 2010); as a consequence we consider this process to be internally robust.
A particular problem with the quantitative interpretation of these data is that Wd1 suffers from heavy differential reddening and the form of the extinction law is ill-constrained, which in turn leads to a large range of possible bolometric luminosities for individual cluster members (Clark et al. 2019a). As a result we refrain from updating the semi-empirical cluster HR diagram introduced by Negueruela et al. (2010) at this time; instead summarising the data via a colour/magnitude plot (Fig. 9 and Sect. 4.1).
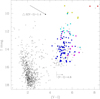 |
Fig. 9. Colour magnitude plot of the 5′×5′ field-of-view centred on Wd1 utilising the photometry of Clark et al. (2005). Cluster members with both spectral types and luminosity classes are denoted as follows: RSGs and YHGs – red and yellow diamonds; B5-9 Ia+ – cyan diamonds; B1-4 Ia,Iab,Ib – cyan squares; O9-B0.5 Ia,Iab,Ib – blue squares; O9-B0.5 II,III – blue circles; early BHG/WNVLh – purple diamonds; WN5-8 and WC8-9 – purple circles. The vector shows the effect of differential reddening across the cluster (cf. Negueruela et al. 2010) assuming an “off-the-peg” Cardelli et al. (1989) prescription. A colour cut for cluster membership of (V − I) ∼ 4.6 as suggested by the OB (super)giants (Sect. 4.1) is also indicated. |
Nevertheless a number of features are obvious from the current analysis:
– The presence of a smooth progression in spectral morphology/stellar classification of evolved stars from late-O giants through to early-mid B supergiants and ultimately late B hypergiants, with the supergiant population dominated by spectral types O9-B1 (60 examples).
– An unprecedentedly rich population of both hot and cool hypergiants with, uniquely, spectral types ranging from O4-5 Ia + (Wd1-30a) to F8 Ia+ (Wd1-8a) and, arguably, M5 Ia (Wd1-20).
– A population of WRs exhibiting a diverse array of spectral sub-types.
– A large number of spectroscopic binary candidates, including a number of interacting/post-interaction systems.
We discuss the implications of these findings in more detail below, in the context of both stellar evolution and the bulk properties of Wd1.
4.1. Stellar content
The extreme mass inferred for Wd1 (Clark et al. 2005; Lim et al. 2013; Andersen et al. 2017) implies that even very rapid/rare phases of massive stellar evolution may be represented. Conversely at an apparent age of ∼5 Myr, we would expect stars of initial mass Minit ≳ 60 M⊙ to have been lost to core-collapse11; as a consequence it is also of interest to review the stellar subtypes that are not present. Considering first the least evolved members and, as might be expected, very early O2-4 I-III stars – found within the youngest (≲2 Myr) clusters such as R136 and NGC 3603; (Crowther et al. 2016; Melena et al. 2008; Roman-Lopes et al. 2016) – are absent from Wd1. Instead, the earliest stars present are the O4-5 Ia+ and O7-8 Ia+ hypergiants Wd1-30a and Wd1-27, which appear to be the products of binary evolution (Sect. 4.4; Clark et al. 2019a). Discounting these stars on this basis, the earliest “canonical” supergiants are of spectral type ∼O9Ib...Iab (e.g. Wd1-15 and -17).
The presence of a rich population of late-O to mid-B supergiants has long been recognised (Clark et al. 2005; Negueruela et al. 2010). In contrast to such earlier spectroscopic studies, our observations include large numbers of lower luminosity objects in Wd1, with target selection based on photometry consistent with heavily-reddened OB stars. These criteria would not distinguish between O9 III stars evolving to become such luminous OB supergiants – which are seen in large numbers – and early B0.5-2 Ib...II stars from an older population of stars with lower initial masses currently evolving to the RSG phase. Such stars would be readily distinguished from the O9 III population by the presence of strong He I (and possibly N I) lines and the absence of C III. Critically they are entirely absent from our survey; the only B-type objects are super-/hypergiants of sufficient luminosity that they are consistent with the wider evolved stellar population of Wd1 (Sect. 4.2).
Examples of every transitional evolutionary phase between H-rich OB supergiants and H-depleted WRs are found within Wd1 (e.g. BHG, LBV, sgB[e], YHG, and RSG). Surprisingly, only one LBV is identified (Wd1-243; Clark & Negueruela 2004), compared to large numbers of confirmed and candidate systems within, for example, the Quintuplet (Clark et al. 2018b)12. Intriguingly, Wd1-243 also has a rather moderate mass-loss rate (Ritchie et al. 2009b; Fenech et al. 2018) in comparison to other (candidate) LBVs such as P Cygni (Najarro 2001), AG Car (Groh et al. 2009) and HDE 316285 (Hillier et al. 1998) where, unlike Wd1-243, the wind densities are sufficient to drive the Paschen series into emission. One might appeal to the comparatively low temerature of Wd1-243 to explain this discrepancy; however the Paschen series is seen in emission in the YHG IRAS 18457−0604, which appears to be of comparable spectral type to Wd1-243 (Clark et al. 2014a). Expanding on this point, and it is noteworthy that the population of YHGs within Wd1 also lack the pronounced emission line spectra of other examples, such as IRAS 18457−0604 and IRC +10 420 (Clark et al. 2014a). Apparently comparatively low mass loss rates are a feature of the current population of LBVs and YHGs within Wd1, although the presence of extended mm-/radio nebulae associated with a number of these stars is indicative of extensive mass loss in the recent past (Dougherty et al. 2010; Andrews et al. 2018; Fenech et al. 2018).
Finally we turn to the WR content of Wd1. A wide range of WN sub-types are present, although the earliest (WN2-4) examples are not represented (Table 3). No WN5-9ha stars are observed; consistent with the expectation that they descend from exceptionally massive stars (e.g. Lohr et al. 2018a; Schnurr et al. 2008; Bonanos et al. 2004). Three late WN9-11h stars are identified (Wd1-5, -13 and -44); however all are potentially the products of binary interaction (Ritchie et al. 2010; Clark et al. 2014b, and in prep.). In contrast to the WN stars, the WC stars are uniformly of late (WC8-9) spectral subtype; neither transitional WN/WC nor WCE stars are identified; we return to this in Sect. 4.3. Lastly, Groh et al. (2013) predict that non-rotating (rotating) stars of Minit ≳ 50 M⊙ (≳32 M⊙) present as WRs of WO subtype immediately prior to core-collapse. Once again no examples are found within Wd1; however with predicted optical magnitudes ≳1.5 mag fainter than those of O9-9.5 III stars, this is perhaps unsurprising (Groh et al. 2013; Martins & Plez 2006).
Summary of the WR populations of Wd1 and the Arches, Quintuplet and Galactic centre clusters.
We may summarise these results graphically via the updated colour/magnitude diagram given in Fig. 9, constructed with the dataset presented in Clark et al. (2005); inevitably this excludes the 62 stars with spectral classifications but lacking suitable photometry (Table A.1). Nevertheless, remaining cluster members are clearly delineated from field stars by their excessive reddening, with the detection threshold set by the V-band magnitude. Stars assigned both a spectral types and luminosity class are further indicated; unfortunately a subset of binaries cannot be designated on this basis (Wd1-9, -36, -53a and those in footnote 10). The progression in both magnitude and colour with spectral classification is broadly as expected with, for example, the cool super/hypergiants being systematically redder and brighter than the OB (super-)giants. The breadth of the region occupied by cluster members in the diagram is indicative of significant differential reddening, with Negueruela et al. (2010) finding ΔE(V − I) ∼ 5.0−6.4 mag and a mean of ∼5.5 ± 0.3 mag from cluster blue supergiants. Utilising the colours of OB stars presented by Wegner (1994) this suggests a colour cut for cluster members of (V − I) ∼ 4.6; as shown in Fig. 9, with the exception of a single outlier this indeed serves as a suitable discriminant. Uncertainties in spectral classification and the effect of binarity likewise contribute to the overlapping regions occupied by, for example, O9-B0.5 stars of luminosity classes I and II...III (cf. Sects. 3.4.1 and 3.5). Finally the diagram reveals the residual incompleteness of our current spectroscopic survey. This is particularly prevalent amongst the fainter cohort of members, although this shortcoming also extends to stars within the cluster core with luminosities suggestive of a supergiant nature, but which still await spectral classification (e.g. Wd1-12b, -39a and 40a) and, in some cases, photometric observations.
4.2. Bulk properties of Westerlund 1
4.2.1. Cluster age
Previous studies attempting to determine the age of Wd1 have focused on both high- and low-mass stellar components. Placement of the OB super-/hypergiant population on a semi-empirical HR-diagram suggests a high degree of coevality for this cohort, with a comparison to evolutionary tracks implying an age of ∼5 Myr (Negueruela et al. 2010; Meynet & Maeder 2003; Ekström et al. 2012). Similar conclusions were drawn from a proper-motion selected photometric study by Kudryavtseva et al. (2012), who were able to demonstrate that the form of the pre-MS transition in Wd1 is consistent with a co-eval population at an age of 5 Myr with a comparatively small uncertainty (< 0.4 Myr). However age determinations via both techniques rely on the applicability of isochrones derived from evolutionary codes for single stars and are further hampered by uncertainties in distance and extinction measurements (cf. Clark et al. 2019a), leading to e.g. a degeneracy in the placement of 3–5 Myr pre-MS isochrones (cf. Andersen et al. 2017; Hosek et al. 2018).
A unique feature of Wd1 is the simultaneous presence of both WRs and RSGs; under the assumption of single star evolution for both cohorts this has led previous studies to infer a relatively narrow age range of ∼4.5−5 Myr (Clark et al. 2005; Crowther et al. 2006a). Recent research has again emphasised the role that the presence and nature of cool supergiants may play in constraining the ages of young massive clusters, especially if the placement of the main-sequence is uncertain due to the effects of binary interaction (e.g. Britavskiy et al. 2019; Beasor et al. 2019). However current evolutionary predictions by different groups fail to converge on a consistent set of physical properties for this phase (cf. comparison in Britavskiy et al. 2019; see also Davies et al. 2018 for a comparison to observations); potentially complicating the employment of such a diagnostic.
Unfortunately a combination of saturation and blending of the Wd1 RSGs at IR wavelengths precludes accurate determinations of their luminosities for comparison to such predictions. Clark et al. (2005) suggest the cluster YHGs are particularly luminous (Lbol/L⊙ ≳ 5.7); if such stars evolve at essentially constant bolometric luminosity they will yield RSGs that are more luminous than those inferred to exist within the Magellanic Clouds (Davies et al. 2018), although nominally consistent with the predictions of Ekström et al. (2012) for non-rotating stars. As a consequence, quantitative determination of physical properties of the RSG cohort of Wd1 may prove to be particularly valuable in both constraining the cluster age and, more widely, in validating evolutionary predictions for this phase of stellar evolution.
Nevertheless, given that the uncertain extinction law towards Wd1 greatly complicates tailored quantitative analyses for individual hot and cool stars (cf. Clark et al. 2014b, 2019a) we defer the assembly of an empirical HR diagram – and consequent comparison of the cluster population to theoretical isochrones – until this issue is resolved. As such we are currently unable to improve on the quantitative age estimate of Negueruela et al. (2010). Notwithstanding this, the newly classified cohort of early-type stars appears qualitatively consistent with the assertion that the (massive) stellar population of Wd1 is essentially co-eval. Specifically, the super-/hypergiant evolutionary sequence described by Negueruela et al. (2010) can now be extended to lower-luminosity giants of systematically earlier (O9-9.5) spectral type, yielding a remarkably homogeneous population of OB stars within Wd1. In the (current) absence of an identifiable population of core H-burning stars of luminosity class V, the sole examples of O stars of even earlier (< O9) spectral type appear to be binary products, while no B supergiants descending from stars of lower initial masses have been distinguished. We therefore conclude that, subject to completeness (Sect. 4.1), our current stellar census provides no qualitative evidence for younger or older stellar populations within Wd1.
4.2.2. Stellar and cluster masses
Utilising a combination of stellar evolution and non-LTE model-atmosphere codes, Groh et al. (2014) and Martins & Palacios (2017) calculated synthetic spectra for single non-rotating massive stars, from which empirical spectral classifications can be derived for comparison to real data. Both sets of calculations imply that stars with Minit ∼ 60 M⊙ fail to yield the early-mid B supergiants present within Wd1; indeed at an age of > 4 Myr such stars should already have been lost to SNe (footnote 11). Conversely, the late-O giants identified in this work do not form under Minit ≤ 20 M⊙ pathways. This leaves a 20 M⊙ < Minit < 50 M⊙ window which appears to yield OB stars of the spectral type and luminosity class found within Wd1, with the WR cohort deriving from the upper reaches of this range. The eclipsing binary Wd1-13 provides direct support for this supposition, with Ritchie et al. (2010) deriving current dynamical masses of  and
and  for the B0.5 Ia+/WNVLh and OB supergiant components, respectively. Under highly non-conservative late-Case A/Case B mass transfer, a pre-interaction Minit ∼ 40 M⊙ is inferred for the primary. Similarly high progenitor masses are suggested by quantitative analyses of Wd1-5, -27 and -30a (Clark et al. 2014b, 2019a). Although subject to systematic uncertainties in both cluster distance and extinction law the semi-empirical HR diagram of Negueruela et al. (2010) is also fully consistent with this hypothesis.
Outside of Wd1, few dynamical mass-estimates for late-O/early-B stars of luminosity class I-III are available; being limited to CC Cas (O8.5 III, 35.4 ± 5 M⊙; Gies 2003), the secondary in the detatched binary HD 166734 (O9 I(f),  ; Mahy et al. 2017) and the evolved, post-interaction primary in Cyg OB2-B17 (O9 Iaf, 45 ± 4 M⊙; Stroud et al. 2010). Nevertheless these are consonant with both values derived from Wd1 and also the mass range inferred for field B0-3 Ia stars (∼25−40 M⊙) by Crowther et al. (2006b).
Following from the above we may attempt to infer an integrated mass for Wd1 from the massive star census, assuming a Maschberger (2013) IMF with standard parameters, including an upper-mass slope of 2.3 (ie. Salpeter). If we take a highly conservative limit that the 166 spectrally classified cluster members span a range of 20–50 M⊙ then the current mass of Wd 1 (ie. the mass of stars between 0.1 and 50 M⊙) is ∼6 × 10⁴ M⊙ (with a ∼5 per cent error due to the relatively low-number of massive stars).
However, with a rather more realistic mass range of 25–50 M⊙, the current mass of Wd 1 is ∼9 × 10⁴ M⊙ (again with a ∼5 per cent error). This significant increase is due to the high-power of the upper mass slope meaning that shifting the lower mass limit from 20 to 25 M⊙ increases the total mass by 50 per cent, showing the crucial importance of accurately determining the lower mass limit. Conversely, the upper mass limit is much less important; for example if we were to specify a range of masses of 20–45 M⊙, the estimated integrated mass would increase by less than 10 per cent.
We refrain from specifying a contribution from higher mass stars since it would require an extrapolation of the mass function to stars already lost to core-collapse and likely comprises a comparatively minor contribution to the integrated cluster mass. Moreover, we caution that if the complete initial mass function departs from a Salpeter form – for example if it is top-heavy – the above masses would be over-estimates.
4.3. Comparison to other young massive clusters
At this juncture it is instructive to compare the stellar population of Wd1 to other young massive clusters. Both NGC 3603 and R136 are sufficiently young (∼1−2 Myr; Melena et al. 2008; Crowther et al. 2016) that their demographics are very different from Wd1 and so we do not consider them further here. Of more relevance are the three clusters in the central molecular zone of the Galaxy. Both the Arches and Quintuplet are expected to be younger than Wd1 (∼2−3.3 Myr and ∼3−3.6 Myr respectively; Clark et al. 2018a,b, 2019b); however, the situation is less clear cut for the Galactic centre cluster, with an age of 6 ± 2 Myr typically quoted (Paumard et al. 2006)13.
Once differing ages are taken into account, similarities are apparent between the evolutionary sequences of H-rich cluster members of the Arches, Quintuplet and Wd1 (with the Galactic centre population insufficiently sampled for comparison). Specifically, stars in the three clusters demonstrate a smooth progression in spectral morphologies extending from OB supergiants (O4-6 Ia, O7-B0 Ia and O9-B4 Ia respectively) through to hypergiants (O4-8 Ia+, B0-3 Ia+ and B5-9 Ia+). While absent from the Arches due to its youth, more advanced evolutionary phases, such as LBVs and the related WN9-11h stars, are found within the Quintuplet, with the YHGs and RSGs playing an analogous role in Wd1. Moreover, both Wd1 and the Quintuplet contain a cohort of stars with anomalously early spectral types14, of which a number would fit seemlessly into the Arches cluster; potentially indicative of binary interaction and rejuventation (Sect. 4.4 and Clark et al. 2018a,b).
However the WR cohorts of the four clusters look very different from one another (Table 3). The Arches appears too young for any H-free examples to be present, with a population solely confined to WN7-9ha stars (Clark et al. 2019b). Conversely, WN sub-types appear surprisingly under-represented within the Quintuplet, which contains just three WN9-11h, two WNLha (footnote 14) and a single WN6 star – despite Groh et al. (2014) predicting a WNE phase lasting ∼3× longer than the WNL phase. Instead the cluster is dominated by WC8-9 stars (Table 3), many of which appear to be binaries identifiable by excess IR emission from hot dust (Clark et al. 2018b, and references therein); again none of the WCE stars anticipated by Groh et al. (2014) are present. In stark constrast, the WN:WC star ratio is reversed for Wd1, with all spectral sub-types from WN5 to WN11h represented, albeit with an apparent (weak) bias towards earlier (WN5-7) stars.
The WN:WC ratio for the Galactic centre cluster is more evenly balanced although, unlike Wd1, the WN population appears biased towards later spectral sub-types (Table 3). As with the Quintuplet and Wd1, the WC population is dominated by WC8-9 sub-types, with the exception of a single WC5/6 star. Based on spectral morphologies, Martins et al. (2007) suggest an evolutionary sequence of:
WN9h→WN8→WN/WC→WC8-9
for stars within this cluster. No such simple scheme can be constructed for Wd1 due to an absence of transitional WN/WC stars and the range of WN spectral sub-types observed. Similarly the almost complete lack of H-free WN stars within the Quintuplet complicates interpretation of evolution from the BHG/LBV/WN9-11h to WC phase at very high initial masses (≳60 M⊙; Clark et al. 2018b); we return to these observational findings in Sect. 4.4.
We may also extend this comparison beyond core-collapse. One of the defining features of Wd1 is the presence of the magnetar CXO J164710.2−455216 (Muno et al. 2006a). Intriguingly, a magnetar has also been associated with the Galactic centre cluster (SGR J1745−29; Kennea et al. 2013; Mori et al. 2013), while PSR J1746−2850 – either a high B-field pulsar or transient magnetar – is located in close proximity to the Quintuplet (∼5 pc; Deneva et al. 2009; Dexter et al. 2017) although, given the population of isolated massive stars in the central molecular zone, an unambiguous physical association has yet to be proven. Finally, in terms of stellar content – and hence age – the host cluster of SGR 1806−20 appears to be directly comparable to the Quintuplet (Figer et al. 2005; Bibby et al. 2008). These observations strongly suggest that clusters in the ∼3−6 Myr age window appear efficient sites for the formation of magnetars, despite a naive expectation that under a single star evolutionary channel such massive progenitors should instead form black holes. In turn this implies that either the physical process by which neutron stars form from massive progenitors favours the production of magnetars (cf. Clark et al. 2014a) or that (counter-intuitively) a large fraction of neutron stars are born as magnetars; a conclusion recently reached by Beniamini et al. (2019).
4.4. Binarity and evolutionary channels
Two key findings of this work are the unprecedented range of hypergiants within Wd1 – not reproducible for a co-eval stellar population under single star evolution (e.g. Ekström et al. 2012; Brott et al. 2011) – and the apparently rich binary population amongst the earliest O stars present. Specifically, of the 27 O9-9.5 III stars within Wd1 (Table A.1), one is a confirmed photometric binary (W1021) and 13 have anomalously broad Paschen lines apparently indicative of binarity (of which three are RV variable; Sects. 3.4.3 and 3.5 and footnote 8). Moreover, a further 10 objects have Paschen lines sufficiently broad to preclude precise classification but otherwise appear observationally consistent with an O+O designation (footnote 10). This appears indicative of a remarkably high binary fraction, although we caution that with both components of comparable luminosity – as shown by their composite spectra – such systems will be systematically brighter than their single siblings, introducing a potentially significant bias into their identification. Irrespective of this, we also identify similar candidate spectroscopic binaries amongst brighter, more evolved stars (footnote 9), while we are able to confirm that a number of photometric binaries from Bonanos (2007) are indeed luminous OB cluster members (e.g. Wd-36, -53, and W1048).
These results are consonant with previous observations which imply a large number of massive binaries within Wd1. Examples include (i) a binary fraction of ≳70% inferred for WR stars via IR and X-ray observations (Crowther et al. 2006a; Clark et al. 2008, 2019b) and (ii) the embodiment of very short-lived phases of binary interaction such as Wd1-9, which is thought to be undergoing rapid case-A mass transfer (Clark et al. 2013).
Given the wealth of observational diagnostics, we defer a quantitative analysis of the full binary population of Wd1 to a future paper, where we present a synthesis of multiple datasets, including results from our full RV spectroscopic survey (Clark et al., in prep.). Nevertheless, just considering the data presented here provides compelling observational evidence for the role that binary-driven evolution plays within Wd1.
Following Negueruela et al. (2010) we may presume a single star evolutionary channel broadly progressing:
late-O giants → early-B supergiants → mid to late-B hypergiants → YHG/RSGs
before looping back bluewards to H-depleted WRs, potentially via an LBV phase (cf. Wd1-243). However neither the mid-O nor the early-B hypergiants within Wd1 are consistent with such a scenario and hence we must suppose two futher, binary-modulated channels to yield these stars (cf. Clark et al. 2019a).
The first is uncontroversial and presumably occurs as the primary evolves towards the supergiant phase and fills its Roche lobe, with the resultant binary-driven mass stripping yielding undermassive but overluminous and chemically peculiar WNLh/BHG stars such as Wd1-5, -13, -44 and, presumably, W1049 (Petrovic et al. 2005; Ritchie et al. 2010; Clark et al. 2014b). Secondly one might suppose that such binary interaction may also lead to the secondary accreting significant quantities of mass or, in extreme cases, merger. In this case one would expect a very luminous and massive blue straggler to form; examples being Wd1-27 and -30a (de Mink et al. 2014; Schneider et al. 2014; Clark et al. 2019a). Such a channel is more controversial since it requires the secondary to be able to accrete large quantities of mass without spinning it up to critical rotation via the transfer of angular momentum (which would quickly halt accretion; Petrovic et al. 2005; de Mink et al. 2014); physical mechanisms that might facilitate this include angular momentum loss via an accretion disc or tidal interaction between both components.
Unfortunately, the relative prevalence or weighting of both channels is currently unclear for a number of reasons. Evolutionary codes including all relevant physical processes have yet to be constructed, with the efficiency of the accretion of mass and angular momentum essentially treated as a free parameter at this point. This uncertainty also means that subsequent, post-interaction evolution is opaque; given the wide range of WN sub-types present within Wd1 it would appear highly likely that some result from a binary evolutionary channel (cf. Clark et al. 2019c), but we lack theoretical predictions to validate this conclusion (cf. Groh et al. 2014). Observationally, one might expect that in many realisations of mass-stripping the secondary dominates the emergent, post-interaction spectrum of the binary, preventing identification and characterisation of the primary (cf. Götberg et al. 2018).
Focusing specifially on Wd1 and since the secondary in Wd1-13 superficially resembles other cluster supergiants (Ritchie et al. 2010), one might suppose that a number of apparently single OB stars within Wd1 are also in a post-interaction phase. However extensive and systematic quantitative model-atmosphere analysis will be required to identify such binary products via their anticipated rapid rotation and/or anomalous chemical abundances. Indeed we caution that while the mass ratio has reversed in Wd1-13, we cannot empirically constrain the quantity of mass the secondary has accreted at this time, and hence whether the system evolved via (quasi-)conservative mass-transfer.
As a consequence we are simply left with the conclusion that both channels must operate in parallel in Wd1, with Wd1-27 and -30a indicating that mass-transfer may be very efficient (Clark et al. 2019a). Conversely, the extreme mass loss rate exhibited by the sgB[e] star and interacting binary Wd1-9 reveals that in certain instances much of the mass stripped from the primary is lost from the system rather than accreted by the secondary (Clark et al. 2013; Fenech et al. 2017, 2018).
5. Concluding remarks and future prospects
In this work we present classifications of a further 69 members of Wd1, producing a current census of 166 massive, evolved stars. As expected, given the photometric selection criteria adopted, the majority of these are late-O stars of luminosity type I-III, which smoothly extend the morphological sequence of hot and cool super-/hypergiants identified by Negueruela et al. (2010; Sect. 4.4) to higher temperature and less evolved objects. While a handfull of B-type supergiants and two new hypergiants have also been identified, no lower luminosity B stars – which would be indicative of an older stellar population – have been discovered. Likewise we find no evidence for a younger, more massive population. We conclude that on this basis our current stellar census is consistent with the hypothesis that Wd1 is co-eval.
Unfortunately, given the limitations of these data and uncertainties in both the distance and extinction towards Wd1 it is premature to construct an HR diagram for the cluster and so we may not improve on previous quantitative age estimates via comparison to theoretical isochrones, or provide initial masses for individual stars. However comparison to the stellar population of the ∼3−3.6 Myr old Quintuplet (Clark et al. 2018b) reveals systemtic differences, most noticably in the spectral type distributions of OB super-/hypergiants, that indicate that Wd1 is older. Indeed the updated census of massive stars presented here is consistent with previous age estimates of ∼5 Myr derived via a number of different methodologies (Sect. 4.2.1).
Moreover, qualitative comparison of the observations to the single star synthetic spectra generated by Martins & Palacios (2017) suggests that, collectively, the cluster members sampled evolved from 20 M⊙ < Minit < 50 M⊙ progenitors (Sect. 4.2), with more massive stars having already been lost to SNe (Groh et al. 2013). This would in turn imply that we may expect to see an evolutionary turn-off within Wd1 around O7-8 V, corresponding to stellar masses of ∼25 M⊙ (Martins & Palacios 2017; Clark et al. 2019a).
Based on spectral morphology and classification we may construct an apparent evolutionary sequence for H-rich single stars within Wd1 up to the hypergiant phase that is analogous to that inferred for the Quintuplet (Sects. 4.3 and 4.4). However, this progression cannot be extended to the H-free WR cohort for either cluster, with that of Wd1 found to be unexpectedy diverse (Table 3). Moreover a population of massive blue stragglers, with properties inconsistent with these evolutionary pathways, may also be identified within both aggregates (footnote 14). The simplest explanation for these phenomena is the onset of binary interaction as stars evolve beyond luminosity class V.
Consonant with both this hypothesis and previous observational studies, our data suggests a large binary fraction for Wd1 for stars at every evolutionary stage. These comprise both pre-interaction (W1021), interacting (Wd1-9) and post-interaction systems (Wd1-5, -13, -27, -30a and WR A and B). The properties of the latter cohort are indicative of two distinct but related evolutionary channels producing low-mass stripped primaries and potentially rejuvenated, mass-gaining secondaries – the extreme mass-loss associated with the sgB[e] star Wd1-9 indicating that in some instances mass lost from the primary is ejected from the system rather than accreted. Unfortunately our current observations only identify the most extreme examples of massive blue stragglers resulting from the latter pathway. Determining the relative prevalence of both evolutionary channels will require quantitative analysis of the full cohort of OB super-/hypergiants in order to identify the subset which are potential binary products via their rapid rotation, anomalous surface abundances and/or mass/luminosity ratios.
Allowing for both incompleteness and the presence of massive binary companions, a conservative estimate suggests that Wd1 currently contains > 166 stars with Minit ≳ 20 M⊙. Assuming a standard Maschberger IMF this would imply a rather extreme integrated cluster mass of ∼9 × 10⁴ M⊙ (Sect. 4.2).
As a consequence of their large integrated masses, the rich stellar populations of Wd1 and the Arches and Quintuplet clusters provide a unique opportunity to study the post-main sequence evolution of stars with Minit ∼ 20 M⊙ to ≳120 M⊙ in the ∼2−5 Myr window (Clark et al. 2018b, 2019b). Inclusion of clusters such as NGC 3603 or Westerlund 2 would extend this investigation to relatively unevolved very massive stars (∼1 Myr and ≳80 M⊙; Melena et al. 2008; Zeidler et al. 2016; Bonanos et al. 2004; Schnurr et al. 2008). Conversely, older aggregates such as Berkeley 51 and 55 and the RSG dominated clusters at the base of the Scutum-Crux arm (∼10−50 Myr; Lohr et al. 2018b; Davies et al. 2007; Clark et al. 2009) permit the lifecycle of stars of initial masses down to ∼8 M⊙ – delineating the onset of core-collapse – to be explored. Of particular interest is the prospect of characterising the properties of stellar subtypes which have hitherto been poorly studied due to the brevity of the evolutionary phase; a possibility exmplified by the uniquely rich population of hot and cool hypergiants within Wd1.
One may also extend such efforts to core-collapse and beyond. Groh et al. (2013) predict that non-rotating (rotating) stars of Minit ∼ 32 M⊙ (28 M⊙) will undergo core-collapse at an age of 5.81 Myr (7.92) Myr; thus depending on the admixture one would expect all 166 stars within this census to be lost within ≲3 Myr, implying a time-averaged rate of core-collapse of one every ≲18 000 yr over this period (comparable to the rate inferred by Muno et al. 2006b). As a consequence one might anticipate that the immediate progenitors of such a process will be present at this time and, if identifiable, ameanable to quantitative analysis.
This has clear implications for the nature of the resultant relativistic remnant; particularly interesting since clusters such as Wd1 appear to function as highly efficient factories for the production of magnetars (Sect. 4.4). Intriguingly the anticipated magnetic decay timescale for magnetars (∼104 yr; Beniamini et al. 2019 and references therein) is directly comparable to the SN rate within Wd1, suggesting that many core-collapse events must produce such objects. This raises the prospect of delineating the formation channel for magnetars (Clark et al. 2014b) – of particular interest given that they have been hypothesised to power superluminous SNe (Thompson et al. 2004; Woosley 2010; Kasen & Bildsten 2010). Moreover it immediately raises the question of how black holes of masses such as those found in high-mass X-ray binaries (e.g. Cyg X-1 with MBH ∼ 14.8 ± 1.0 M⊙; Orosz et al. 2011), and the more extreme merging black holes detected via gravitational waves, may form, if neutron star formation is strongly favoured for such comparatively massive progenitor stars.
IRAF is distributed by the National Optical Astronomy Observatories, which are operated by the Association of Universities for Research in Astronomy, Inc., under cooperative agreement with the National Science Foundation.
We suggest that this naming convention supercede that employed for the subset of these stars described in previous works (e.g. Ritchie et al. 2009a; Fenech et al. 2018). To enable cross-correlation, where appropriate, we give the old nomenclature in Table A.1.
Three of these stars – F1 (see Ritchie et al. 2009a), F2 and F4 – show a TiO 8860 Å bandhead (Ramsey 1981) with a strength implying they are early-M giants. The remaining objects show spectra typical of late-G or early-K stars, with strong Ca II and Mg I 8807 Å and 8837 Å lines and Paschen series absorption that is either very weak or absent.
N I 8680.4 Å, 8683.4 Å, 8686.1 Å, 8703.2 Å, 8711.7 Å, 8718.8 Å and 8728.9 Å.
W1018, -1024, -1027, -1030, -1034, -1036, and -1064.
W1008, -1022, -1037, -1042, -1045 -1047, -1050, -1056, and -1060.
W1007, -1015, -1023, -1026, -1031, -138, -1051, -1052, -1058, -1059, -1063, and -1066.
W1006, -1012, -1014, -1016, -1017, -1019, -1021, -1028, -1029, -1032, -1035, -1044, and -1061.
W1002, -1040, -1041 and -1055.
W1001, -1003, -1010, -1011, -1013, -1020, -1025, -1046, -1054, and -1062.
Groh et al. (2013) predict that for an age of 4 Myr non-rotating (rotating) stars of ∼60 M⊙ (Minit ∼ 85 M⊙) will currently be underging core-collapse and at 5 Myr Minit ∼ 40 M⊙ (∼60 M⊙).
We note that Gvaramadze (2018) suggest that the LBV MN44 is a runaway from Wd1.
Such a large age spread results from uncertainties in both population synthesis and the quantitative modeling of cluster members (Paumard et al. 2006; Martins et al. 2007). However at most three RSGs may be physically associated with the Galactic centre cluster (Blum et al. 1996) implying a much more extreme WR/(YHG+RSG) ratio than found for Wd1 (33:3 versus 24:10); potentially indicative of a younger age (Davies et al. 2009). Such an assertion is further supported by the rather high dynamical masses inferred for the components of the binary GCIRS 16SW (∼2 × 50 M⊙; Martins et al. 2006).
qF256 (WN8-9ha), -274 (WN8-9ha) and -406 (O7-8 Ia+) and LHO01 (O7-8 Ia+/WNLha) and -54 (O7-8 Ia+) within the Quintuplet and Wd1-5 (WN10-11h/B0.5 Ia+), -13 (B0.5 Ia+), -27 (O7-8 Ia+), -30a (O4-5 Ia+), -44 (WN9h), and W1049 (B1-2Ia+).
Acknowledgments
We are indebted to Prof. Simon Goodwin for calculating the integrated cluster masses discussed in Sect. 4.2. This research is partially supported by the Spanish Government under grants AYA2015-68012-C2-2-P and PGC2018-093741-B-C21 (MICIU/AEI/FEDER, UE), and made use of the SIMBAD database, operated at CDS, Strasbourg, France.
References
- Abramowski, A., Acero, F., Aharonian, F., et al. 2012, A&A, 537, A114 [NASA ADS] [CrossRef] [EDP Sciences] [Google Scholar]
- Aharonian, F., Yang, R., de Õna Wilhelmi, E., et al. 2019, Nat. Astron., 3, 561 [NASA ADS] [CrossRef] [Google Scholar]
- Andersen, M., Gennaro, M., Brandner, W., et al. 2017, A&A, 602, A22 [NASA ADS] [CrossRef] [EDP Sciences] [Google Scholar]
- Andrews, H., Fenech, D., Prinja, R. K., Clark, J. S., & Hindson, L. 2018, MNRAS, 477, L55 [NASA ADS] [CrossRef] [Google Scholar]
- Beasor, E. R., Davies, B., Smith, N., & Bastian, N. 2019, MNRAS, 486, 266 [NASA ADS] [CrossRef] [Google Scholar]
- Bednarek, K., Pabich, J., & Sobczak, T. 2014, Phys. Rev. D, 90, 3008 [CrossRef] [Google Scholar]
- Beniamini, P., Hotokezaka, K., van der Horst, A., & Kouveliotou, C. 2019, MNRAS, 487, 1426 [NASA ADS] [CrossRef] [Google Scholar]
- Bibby, J. L., Crowther, P. A., Furness, J. P., & Clark, J. S. 2008, MNRAS, 386, L23 [NASA ADS] [CrossRef] [Google Scholar]
- Blum, R. D., Sellgren, K., & Depot, D. L. 1996, AJ, 112, 5 [Google Scholar]
- Bonanos, A. Z. 2007, AJ, 133, 2696 [NASA ADS] [CrossRef] [Google Scholar]
- Bonanos, A. Z., Stanek, K. Z., Udalski, A., et al. 2004, ApJ, 611, L33 [NASA ADS] [CrossRef] [Google Scholar]
- Brandner, W., Clark, J. S., Stolte, A., et al. 2008, A&A, 478, 137 [NASA ADS] [CrossRef] [EDP Sciences] [Google Scholar]
- Britavskiy, N., Lennon, D. J., Patrick, L. R., et al. 2019, A&A, 624, A128 [NASA ADS] [CrossRef] [EDP Sciences] [Google Scholar]
- Brott, I., de Mink, S. E., Cantiello, M., et al. 2011, A&A, 530, A115 [NASA ADS] [CrossRef] [EDP Sciences] [Google Scholar]
- Bykov, A. M., Ellison, D. C., Gladilin, P. E., & Osipov, S. M. 2015, MNRAS, 453, 113 [NASA ADS] [CrossRef] [Google Scholar]
- Cardelli, J. A., Clayton, G. C., & Mathis, J. S. 1989, ApJ, 345, 245 [NASA ADS] [CrossRef] [Google Scholar]
- Cesarsky, C. J., & Montmerle, T. 1983, Space Sci. Rev., 36, 173 [NASA ADS] [CrossRef] [Google Scholar]
- Clark, J. S., & Negueruela, I. 2004, A&A, 413, L15 [NASA ADS] [CrossRef] [EDP Sciences] [Google Scholar]
- Clark, J. S., Fender, R. P., Waters, L. B. F. M., et al. 1998, MNRAS, 299, L43 [NASA ADS] [CrossRef] [Google Scholar]
- Clark, J. S., Negueruela, I., Crowther, P. A., & Goodwin, S. 2005, A&A, 434, 949 [NASA ADS] [CrossRef] [EDP Sciences] [Google Scholar]
- Clark, J. S., Muno, M. P., Negueruela, I., et al. 2008, A&A, 477, 147 [NASA ADS] [CrossRef] [EDP Sciences] [Google Scholar]
- Clark, J. S., Negueruela, I., Davies, B., et al. 2009, A&A, 498, 109 [NASA ADS] [CrossRef] [EDP Sciences] [Google Scholar]
- Clark, J. S., Ritchie, B. W., & Negueruela, I. 2010, A&A, 514, A87 [NASA ADS] [CrossRef] [EDP Sciences] [Google Scholar]
- Clark, J. S., Ritchie, B. W., Negueruela, I., et al. 2011, A&A, 531, A28 [NASA ADS] [CrossRef] [EDP Sciences] [Google Scholar]
- Clark, J. S., Najarro, F., Negueruela, I., et al. 2012, A&A, 541, A145 [NASA ADS] [CrossRef] [EDP Sciences] [Google Scholar]
- Clark, J. S., Ritchie, B. W., & Negueruela, I. 2013, A&A, 560, A11 [NASA ADS] [CrossRef] [EDP Sciences] [Google Scholar]
- Clark, J. S., Negueruela, I., & González-Fernández, C. 2014a, A&A, 561, A15 [NASA ADS] [CrossRef] [EDP Sciences] [Google Scholar]
- Clark, J. S., Ritchie, B. W., Najarro, F., Langer, N., & Negueruela, I. 2014b, A&A, 565, A90 [NASA ADS] [CrossRef] [EDP Sciences] [Google Scholar]
- Clark, J. S., Lohr, M. E., Najarro, F., Dong, H., & Martins, F. 2018a, A&A, 617, A66 [NASA ADS] [CrossRef] [EDP Sciences] [Google Scholar]
- Clark, J. S., Lohr, M. E., Patrick, L. R., et al. 2018b, A&A, 618, A2 [NASA ADS] [CrossRef] [EDP Sciences] [Google Scholar]
- Clark, J. S., Najarro, F., Negueruela, I., et al. 2019a, A&A, 623, A83 [NASA ADS] [CrossRef] [EDP Sciences] [Google Scholar]
- Clark, J. S., Lohr, M. E., Patrick, L. R., & Najarro, F. 2019b, A&A, 623, A84 [NASA ADS] [CrossRef] [EDP Sciences] [Google Scholar]
- Clark, J. S., Ritchie, B. W., & Negueruela, I. 2019c, A&A, 626, A59 [NASA ADS] [CrossRef] [EDP Sciences] [Google Scholar]
- Cottaar, M., Meyer, M. R., Andersen, M., & Espinoza, P. 2012, A&A, 539, A5 [NASA ADS] [CrossRef] [EDP Sciences] [Google Scholar]
- Crowther, P. A., Hadfield, L. J., Clark, J. S., Negueruela, I., & Vacca, W. D. 2006a, MNRAS, 372, 1407 [NASA ADS] [CrossRef] [Google Scholar]
- Crowther, P. A., Lennon, D. J., & Walborn, N. R. 2006b, A&A, 446, 279 [NASA ADS] [CrossRef] [EDP Sciences] [Google Scholar]
- Crowther, P. A., Caballero-Nieves, S. M., Bostroem, K. A., et al. 2016, MNRAS, 458, 624 [NASA ADS] [CrossRef] [Google Scholar]
- Davies, B., Figer, D. F., Kudrtizki, R.-F., et al. 2007, ApJ, 671, 781 [NASA ADS] [CrossRef] [Google Scholar]
- Davies, B., Figer, D. F., Kudrtizki, R.-F., et al. 2009, ApJ, 707, 844 [NASA ADS] [CrossRef] [Google Scholar]
- Davies, B., Crowther, P. A., & Beasor, E. R. 2018, MNRAS, 478, 3138 [NASA ADS] [CrossRef] [Google Scholar]
- de Mink, S. E., Sana, H., Langer, N., Izzard, R. G., & Schneider, F. R. N. 2014, ApJ, 782, 7 [NASA ADS] [CrossRef] [Google Scholar]
- Deneva, J. S., Cordes, J. M., & Lazio, T. J. W. 2009, ApJ, 702, L177 [NASA ADS] [CrossRef] [Google Scholar]
- Dexter, J., Degenaar, N., Kerr, M., et al. 2017, MNRAS, 468, 1486 [NASA ADS] [CrossRef] [Google Scholar]
- Dougherty, S. M., Clark, J. S., Negueruela, I., Johnson, T., & Chapman, J. M. 2010, A&A, 511, A58 [NASA ADS] [CrossRef] [EDP Sciences] [Google Scholar]
- Ekström, S., Georgy, C., Eggenberger, P., et al. 2012, A&A, 537, A146 [NASA ADS] [CrossRef] [EDP Sciences] [Google Scholar]
- Evans, C. J., Taylor, W. D., Hénault-Brunet, V., et al. 2011, A&A, 530, A108 [NASA ADS] [CrossRef] [EDP Sciences] [Google Scholar]
- Fenech, D. M., Clark, J. S., & Prinja, R. K. 2017, MNRAS, 464, L75 [NASA ADS] [CrossRef] [Google Scholar]
- Fenech, D. M., Clark, J. S., Prinja, R. K., et al. 2018, A&A, 617, A137 [NASA ADS] [CrossRef] [EDP Sciences] [Google Scholar]
- Figer, D. F., Najarro, F., Geballe, T. R., Blum, R. D., & Kudritzki, R. P. 2005, ApJ, 622, L49 [NASA ADS] [CrossRef] [Google Scholar]
- Gennaro, M., Brandner, W., Stolte, A., & Henning, Th 2011, MNRAS, 412, 2469 [NASA ADS] [CrossRef] [MathSciNet] [Google Scholar]
- Gennaro, M., Goodwin, S. P., Parker, R. J., Allison, R. J., & Brandner, W. 2017, MNRAS, 472, 1760 [NASA ADS] [CrossRef] [Google Scholar]
- Gies, D. R. 2003, in A Massive Star Odyssey: From Main Sequence to Supernova, eds. K. van der Hucht, A. Herrero, & C. Esteban, IAU Symp., 212, 91 [NASA ADS] [Google Scholar]
- González-Ferández, C., Dorda, R., Negueruela, I., & Marco, A. 2015, A&A, 578, A3 [NASA ADS] [CrossRef] [EDP Sciences] [Google Scholar]
- Götberg, Y., de Mink, S. E., Groh, J. H., et al. 2018, A&A, 615, A78 [NASA ADS] [CrossRef] [EDP Sciences] [Google Scholar]
- Groh, J. H., Hillier, D. J., Damineli, A., et al. 2009, ApJ, 698, 1698 [NASA ADS] [CrossRef] [Google Scholar]
- Groh, J. H., Meynet, G., Georgy, C., & Ekstróm, S. 2013, A&A, 558, A131 [NASA ADS] [CrossRef] [EDP Sciences] [Google Scholar]
- Groh, J. H., Meynet, G., Ekström, S., & Georgy, C. 2014, A&A, 564, A30 [NASA ADS] [CrossRef] [EDP Sciences] [Google Scholar]
- Gvaramadze, V. V. 2018, Res. Notes Am. Astron. Soc., 2, 214 [NASA ADS] [CrossRef] [Google Scholar]
- Hillier, D. J., & Miller, D. L. 1998, ApJ, 496, 407 [NASA ADS] [CrossRef] [Google Scholar]
- Hillier, D. J., Crowther, P. A., Najarro, F., & Fullerton, A. W. 1998, A&A, 340, 483 [NASA ADS] [Google Scholar]
- Hosek, M. W., Lu, J. R., Anderson, J., et al. 2018, ApJ, 855, 13 [NASA ADS] [CrossRef] [Google Scholar]
- Jenniskens, P., & Desert, F.-X. 1994, A&AS, 106, 39 [NASA ADS] [Google Scholar]
- Kasen, D., & Bildsten, L. 2010, ApJ, 717, 245 [NASA ADS] [CrossRef] [Google Scholar]
- Kennea, J. A., Burrows, D. N., Kouvelioutou, C., et al. 2013, ApJ, 770, L24 [NASA ADS] [CrossRef] [Google Scholar]
- Koumpia, E., & Bonanos, A. Z. 2012, A&A, 547, A30 [NASA ADS] [CrossRef] [EDP Sciences] [Google Scholar]
- Kudryavtseva, N., Brandner, W., Gennaro, M., Rochau, B., Stolte, A., et al. 2012, ApJ, 750, L44 [NASA ADS] [CrossRef] [Google Scholar]
- Lim, B., Chun, M., Sung, H., et al. 2013, AJ, 145, 46 [NASA ADS] [CrossRef] [Google Scholar]
- Lohr, M. E., Clark, J. S., Najarro, F., et al. 2018a, A&A, 617, A66 [NASA ADS] [CrossRef] [EDP Sciences] [Google Scholar]
- Lohr, M. E., Negueruela, I., Tabanero, H. M., et al. 2018b, MNRAS, 478, 3825 [NASA ADS] [Google Scholar]
- Mahy, L., Damerdiji, Y., Gosset, E., et al. 2017, A&A, 607, A96 [NASA ADS] [CrossRef] [EDP Sciences] [Google Scholar]
- Martins, F., & Plez, B. 2006, A&A, 457, 637 [NASA ADS] [CrossRef] [EDP Sciences] [Google Scholar]
- Martins, F., & Palacios, A. 2017, A&A, 598, A56 [NASA ADS] [CrossRef] [EDP Sciences] [Google Scholar]
- Martins, F., Trippe, S., Paumard, T., et al. 2006, ApJ, 649, L103 [NASA ADS] [CrossRef] [Google Scholar]
- Martins, F., Genzel, R., Hillier, D. J., et al. 2007, A&A, 468, 233 [NASA ADS] [CrossRef] [EDP Sciences] [Google Scholar]
- Maschberger, T. 2013, MNRAS, 429, 1725 [NASA ADS] [CrossRef] [Google Scholar]
- Massey, P., DeGioia-Eastwood, K., & Waterhouse, E. 2000, AJ, 119, 2214 [NASA ADS] [CrossRef] [Google Scholar]
- Massey, P., DeGioia-Eastwood, K., & Waterhouse, E. 2001, AJ, 121, 1050 [NASA ADS] [CrossRef] [Google Scholar]
- Mauerhan, J. C., Muno, M. P., Morris, M. R., Stolovy, S. R., & Cotera, A. 2010, ApJ, 710, 706 [NASA ADS] [CrossRef] [Google Scholar]
- Melena, N. W., Massey, P., Morrell, N. I., & Zangari, A. M. 2008, AJ, 135, 878 [NASA ADS] [CrossRef] [Google Scholar]
- Meynet, G., & Maeder, A. 2003, A&A, 404, 975 [NASA ADS] [CrossRef] [EDP Sciences] [Google Scholar]
- Mori, K., Gotthelf, E. V., Zhang, S., et al. 2013, ApJ, 770, L23 [NASA ADS] [CrossRef] [Google Scholar]
- Muno, M. P., Clark, J. S., Crowther, P. A., et al. 2006a, ApJ, 636, L41 [NASA ADS] [CrossRef] [Google Scholar]
- Muno, M. P., Law, C., Clark, J. S., et al. 2006b, ApJ, 650, 203 [NASA ADS] [CrossRef] [Google Scholar]
- Najarro, F. 2001, ASP Conf. Ser., 233, 133 [NASA ADS] [Google Scholar]
- Negueruela, I., Steele, I. A., & Bernabeu, G. 2004, Astron. Nachr., 325, 749 [Google Scholar]
- Negueruela, I., Clark, J. S., & Ritchie, B. W. 2010, A&A, 516, A78 [NASA ADS] [CrossRef] [EDP Sciences] [Google Scholar]
- Ohm, S., Hinton, J. A., & White, R. 2013, MNRAS, 434, 2289 [Google Scholar]
- Orosz, J. A., McClintock, J. E., Aufdenberg, J. P., et al. 2011, ApJ, 742, 84 [NASA ADS] [CrossRef] [Google Scholar]
- Pamyatnykh, A. A. 1999, AcA, 49, 119 [NASA ADS] [Google Scholar]
- Pasquani, L., Avila, G., Blecha, A., et al. 2002, The Messenger, 110, 1 [NASA ADS] [Google Scholar]
- Paumard, T., Genzel, R., Martins, F., et al. 2006, ApJ, 643, 1011 [NASA ADS] [CrossRef] [Google Scholar]
- Petrovic, J., Langer, N., & van der Hucht, K. A. 2005, A&A, 435, 1013 [NASA ADS] [CrossRef] [EDP Sciences] [Google Scholar]
- Ramsey, L. W. 1981, AJ, 86, 557 [NASA ADS] [CrossRef] [Google Scholar]
- Ritchie, B. W., Clark, J. S., Negueruela, I., & Crowther, P. A. 2009a, A&A, 507, 1585 [NASA ADS] [CrossRef] [EDP Sciences] [Google Scholar]
- Ritchie, B. W., Clark, J. S., Negueruela, I., & Najarro, F. 2009b, A&A, 507, 1597 [NASA ADS] [CrossRef] [EDP Sciences] [Google Scholar]
- Ritchie, B. W., Clark, J. S., Negueruela, I., & Langer, N. 2010, A&A, 520, A48 [NASA ADS] [CrossRef] [EDP Sciences] [Google Scholar]
- Ritchie, B. W., Clark, J. S., & Negueruela, I. 2011, Bulletin de la Societe Royale des Sciences de Liege, 80, 628 [NASA ADS] [Google Scholar]
- Roman-Lopes, A., Franco, G. A. P., & Sanmartim, D. 2016, ApJ, 823, 96 [NASA ADS] [CrossRef] [Google Scholar]
- Schneider, F. R. N., Izzard, R. G., de Mink, S. E., et al. 2014, ApJ, 780, 117 [NASA ADS] [CrossRef] [Google Scholar]
- Schneider, F. R. N., Ramírez-Agudelo, O. H., Tramper, F., et al. 2018, A&A, 618, A73 [NASA ADS] [CrossRef] [EDP Sciences] [Google Scholar]
- Schnurr, O., Moffat, A. F. J., St-Louis, N., Morrell, N. I., & Guerrero, M. A. 2008, MNRAS, 389, 806 [NASA ADS] [CrossRef] [Google Scholar]
- Stroud, V. E., Clark, J. S., Negueruela, I., et al. 2010, A&A, 511, A84 [NASA ADS] [CrossRef] [EDP Sciences] [Google Scholar]
- Thompson, T. A., Chang, P., & Quataert, E. 2004, ApJ, 611, 380 [NASA ADS] [CrossRef] [Google Scholar]
- van Dishoeck, E. F., & de Zeeuw, T. 1984, MNRAS, 206, 383 [NASA ADS] [CrossRef] [Google Scholar]
- Vink, J. S., Davies, B., Harries, T. J., Oudmaijer, R. D., & Walborn, N. R. 2009, A&A, 505, 743 [NASA ADS] [CrossRef] [EDP Sciences] [Google Scholar]
- Wegner, W. 1994, MNRAS, 270, 229 [NASA ADS] [CrossRef] [Google Scholar]
- Westerlund, B. E. 1961, PASP, 73, 51 [NASA ADS] [CrossRef] [Google Scholar]
- Westerlund, B. E. 1987, A&AS, 70, 311 [NASA ADS] [Google Scholar]
- Wisniewski, J. P., & Bjorkman, K. S. 2006, ApJ, 652, 458 [NASA ADS] [CrossRef] [Google Scholar]
- Woosley, S. E. 2010, AJ, 719, L204 [Google Scholar]
- Zeidler, P., Grebel, E. K., Nota, A., et al. 2016, AJ, 152, 84 [NASA ADS] [CrossRef] [Google Scholar]
Appendix A: Summary of spectral classifications for members of Wd1
Stellar population of Westerlund 1.
All Tables
Summary of the WR populations of Wd1 and the Arches, Quintuplet and Galactic centre clusters.
All Figures
|
Fig. 1. Comparison of R- and I-band photometric magnitudes from Clark et al. (2005) for cluster members listed by Westerlund (1987; open squares) and new confirmed cluster members listed in Table A.1 (solid squares). |
| In the text | |
|
Fig. 2. Montage of I-band spectra of classification standards for apparently single stars of spectral type O9-B2.5. The spectrum of the 3.18-day eclipsing binary Wd1-36 is included to indicate the appearance of SB2 systems of comparable spectral type within Wd1; note the shallow, flat-bottomed Paschen series lines (see Sect. 3.5). |
| In the text | |
|
Fig. 3. New I-band spectra of W1049 and W1069 plotted against a montage of cluster B0-B9 hypergiants in order to permit classification (with the highly luminous B4 Ia star Wd1-57a included for completeness). The spectrum of W1069 has been degraded in resolution (red dashed line) to enable direct comparison to the spectra of B5-9 hypergiants. |
| In the text | |
|
Fig. 4. R-band spectrum of W1049 plotted with comparable spectra of highly luminous cluster super-/hypergiants of spectral type B0-B9. |
| In the text | |
|
Fig. 5. Comparison of the Pa11 line from W1045 (O9.5 II, left panel) and W1015 (O9 III, right panel) to synthetic model atmosphere spectra for 30 kK and 32 kK respectively. Note the influence of He I 8839Å on the blue wing of W1045, which is not well reproduced by the non-tailored fit used. |
| In the text | |
|
Fig. 6. Montage of select FORS2/MXU R-band spectra of newly-identified cluster members. Objects marked with a “*” show very broad Paschen series lines indicative of a SB2. |
| In the text | |
|
Fig. 7. Relative Pa-11 line width as a function of I-band luminosity for targets with photometry from Clark et al. (2005). For clarity, the box in the top left of this figure presents an expanded view of the points within the small dotted region. |
| In the text | |
|
Fig. 8. Comparison the I-band spectra of known and newly-identified candidate binaries with the O9 III star W1015. Wd1-30a is a strong X-ray source indicative of a colliding-wind binary, while Wd1-53 displays a 1.3-day periodic modulation in its light curve and double He I lines, and Wd1-36 is a 3.18-day eclipsing binary. |
| In the text | |
|
Fig. 9. Colour magnitude plot of the 5′×5′ field-of-view centred on Wd1 utilising the photometry of Clark et al. (2005). Cluster members with both spectral types and luminosity classes are denoted as follows: RSGs and YHGs – red and yellow diamonds; B5-9 Ia+ – cyan diamonds; B1-4 Ia,Iab,Ib – cyan squares; O9-B0.5 Ia,Iab,Ib – blue squares; O9-B0.5 II,III – blue circles; early BHG/WNVLh – purple diamonds; WN5-8 and WC8-9 – purple circles. The vector shows the effect of differential reddening across the cluster (cf. Negueruela et al. 2010) assuming an “off-the-peg” Cardelli et al. (1989) prescription. A colour cut for cluster membership of (V − I) ∼ 4.6 as suggested by the OB (super)giants (Sect. 4.1) is also indicated. |
| In the text | |
Current usage metrics show cumulative count of Article Views (full-text article views including HTML views, PDF and ePub downloads, according to the available data) and Abstracts Views on Vision4Press platform.
Data correspond to usage on the plateform after 2015. The current usage metrics is available 48-96 hours after online publication and is updated daily on week days.
Initial download of the metrics may take a while.