Fig. 9
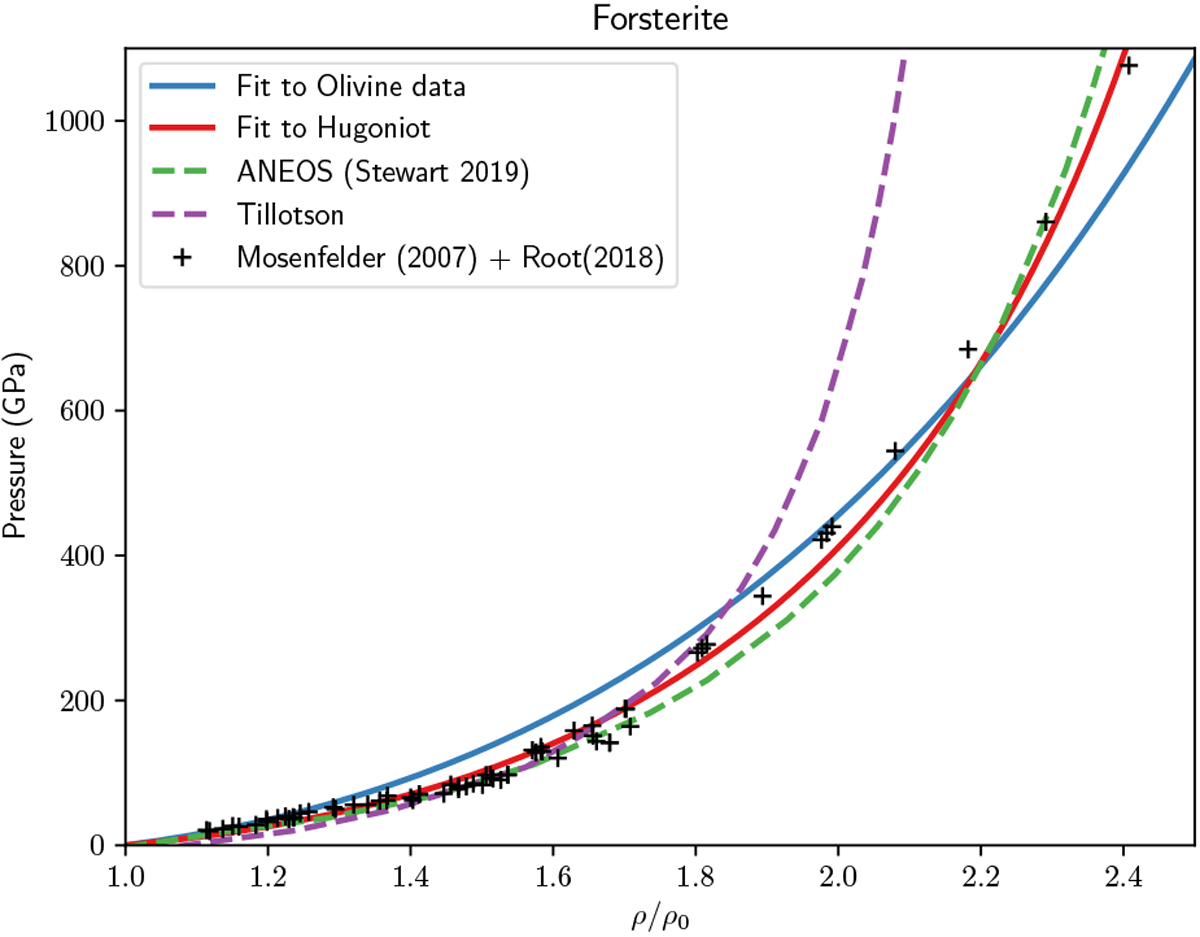
Hugoniot curve for the different fits compared to the results from ANEOS (Stewart et al. 2019). The forsterite experimental data does not exhibit a sharp change as seen in the quartz data and here capturing the melt phase plays a larger role. Both ANEOS and our fit to the Hugoniot conform well with the data, while the fit to the quartz data over pressurizes within the range in which the material has melted (above 100 GPa). We also decided to plot the Tillotson EOS curve for olivine (Marinova et al. 2011), which diverges strongly from the experimental data after around 200 GPa. The experimental data is from Mosenfelder et al. (2007) and Root et al. (2018).
Current usage metrics show cumulative count of Article Views (full-text article views including HTML views, PDF and ePub downloads, according to the available data) and Abstracts Views on Vision4Press platform.
Data correspond to usage on the plateform after 2015. The current usage metrics is available 48-96 hours after online publication and is updated daily on week days.
Initial download of the metrics may take a while.