Fig. 2
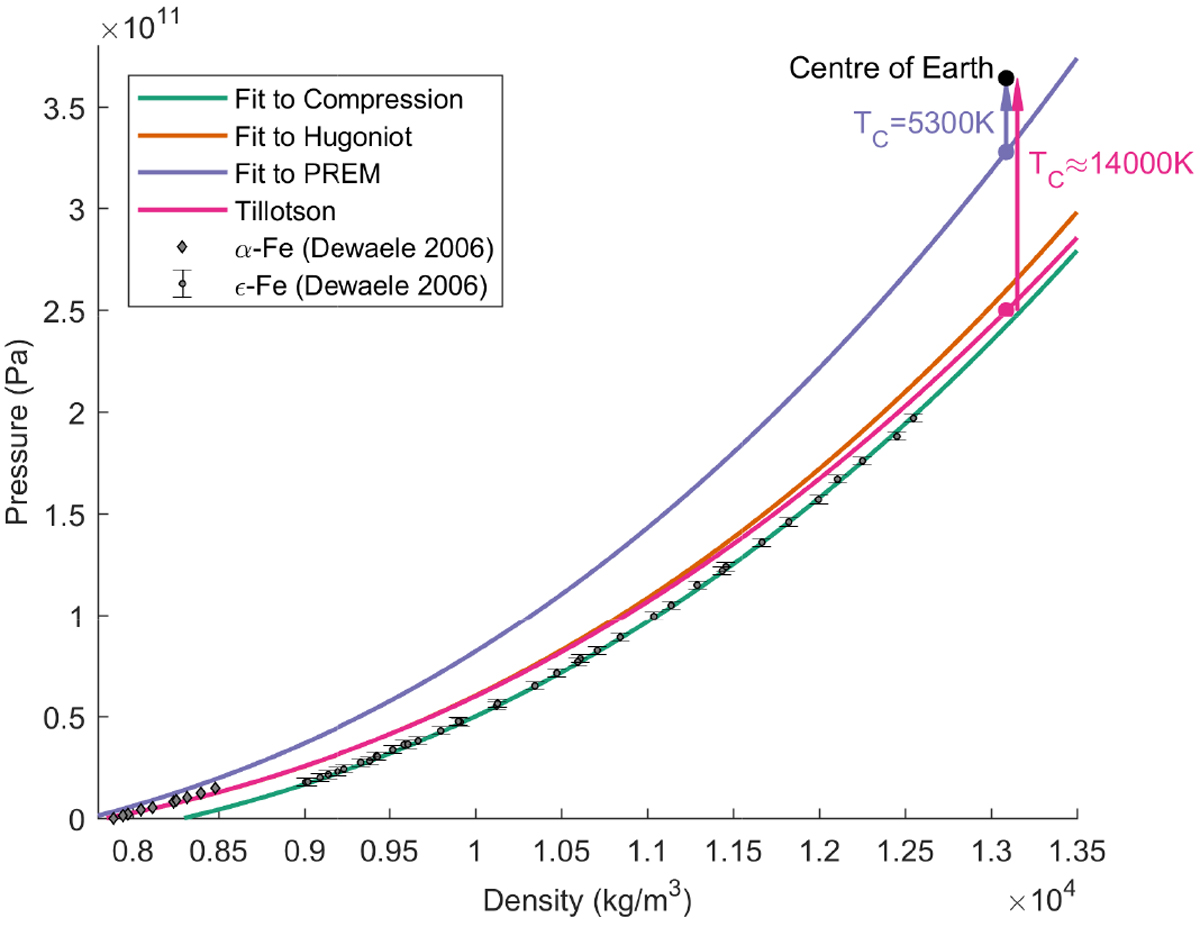
Compression curves of the different models and fits. The green line has been fit to the
ɛ-Fe data from Dewaele et al. (2006) using the Varpoly EOS (![]() ). The phase change at around 16 GPa, from α-Fe to ɛ-Fe is clearly seen in the figure. To reproduce the density and pressure at the center of Earth, the fits to pure iron (compression, Hugoniot, and Tillotson) requires an unrealistically high central temperature of around 14 000K, while the PREM-fit requires a more realistic temperature of around 5300K.
). The phase change at around 16 GPa, from α-Fe to ɛ-Fe is clearly seen in the figure. To reproduce the density and pressure at the center of Earth, the fits to pure iron (compression, Hugoniot, and Tillotson) requires an unrealistically high central temperature of around 14 000K, while the PREM-fit requires a more realistic temperature of around 5300K.
Current usage metrics show cumulative count of Article Views (full-text article views including HTML views, PDF and ePub downloads, according to the available data) and Abstracts Views on Vision4Press platform.
Data correspond to usage on the plateform after 2015. The current usage metrics is available 48-96 hours after online publication and is updated daily on week days.
Initial download of the metrics may take a while.