Fig. 11
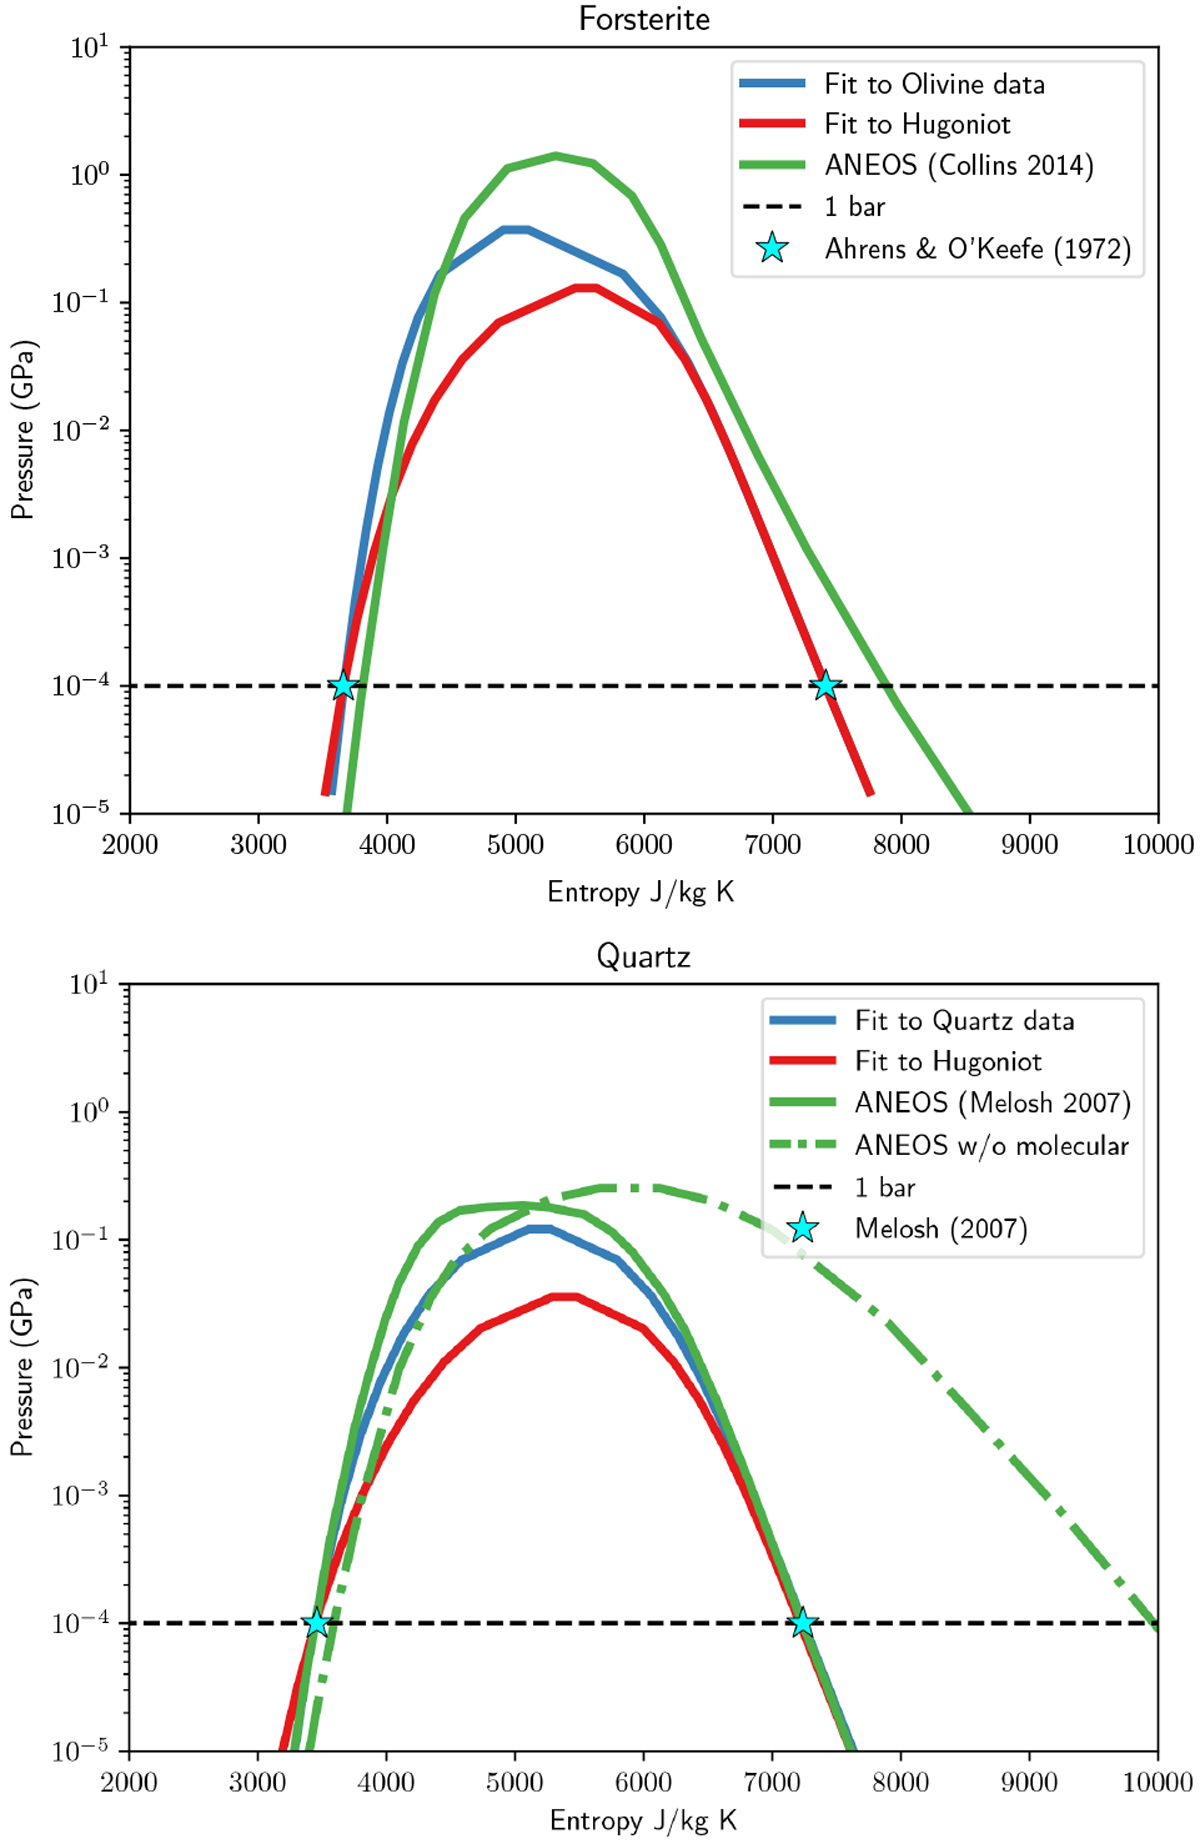
Vapor curve for the different fits compared to the results from ANEOS. Top: case for forsterite. Bottom: case for quartz. We can see that our vapor curves fit the experimental entropy data very well and resemble the results from ANEOS with molecular gas. The critical pressure is generally lower for our models compared to the ANEOS model. For the forsterite vapor curve our model fits the experimental data better then the one from ANEOS (Collins & Melosh 2014). Experimental data for quartz is from Melosh (2007) and for forsterite is from Ahrens & O’Keefe (1972).
Current usage metrics show cumulative count of Article Views (full-text article views including HTML views, PDF and ePub downloads, according to the available data) and Abstracts Views on Vision4Press platform.
Data correspond to usage on the plateform after 2015. The current usage metrics is available 48-96 hours after online publication and is updated daily on week days.
Initial download of the metrics may take a while.