Fig. 10
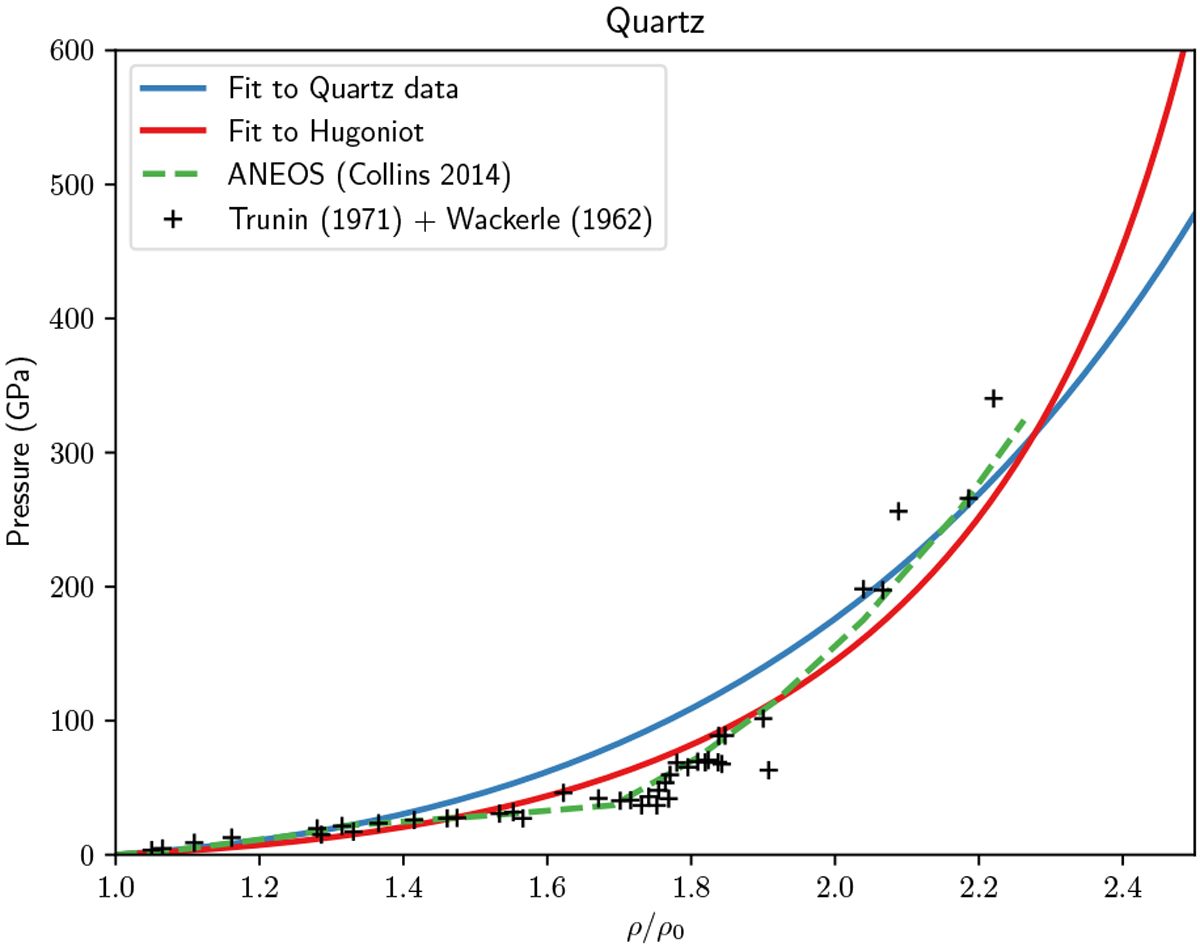
Hugoniot curve for the different fits compared to the results from ANEOS (Collins & Melosh 2014). The experimental data show a sharp change at around
![]() which correlates to the high pressure phase change from quartz to stishovite. ANEOS can be seen to capture this phase transition quite well, while our one phase EOS struggle to fit the experimental data in this region. The experimental data is fromTrunin et al. (1971) and Wackerle (1962).
which correlates to the high pressure phase change from quartz to stishovite. ANEOS can be seen to capture this phase transition quite well, while our one phase EOS struggle to fit the experimental data in this region. The experimental data is fromTrunin et al. (1971) and Wackerle (1962).
Current usage metrics show cumulative count of Article Views (full-text article views including HTML views, PDF and ePub downloads, according to the available data) and Abstracts Views on Vision4Press platform.
Data correspond to usage on the plateform after 2015. The current usage metrics is available 48-96 hours after online publication and is updated daily on week days.
Initial download of the metrics may take a while.