| Issue |
A&A
Volume 635, March 2020
|
|
|---|---|---|
| Article Number | A5 | |
| Number of page(s) | 27 | |
| Section | Catalogs and data | |
| DOI | https://doi.org/10.1051/0004-6361/201935589 | |
| Published online | 28 February 2020 | |
Giant radio galaxies in the LOFAR Two-metre Sky Survey
I. Radio and environmental properties⋆
1
Leiden Observatory, Leiden University, PO Box 9513, 2300 RA Leiden, The Netherlands
e-mail: This email address is being protected from spambots. You need JavaScript enabled to view it.
2
Inter University Centre for Astronomy and Astrophysics (IUCAA), Pune 411007, India
3
ASTRON, The Netherlands Institute for Radio Astronomy, Postbus 2, 7990 AA Dwingeloo, The Netherlands
4
Centre for Astrophysics Research, School of Physics, Astronomy and Mathematics, University of Hertfordshire, College Lane, Hatfield AL10 9AB, UK
5
Indian Institute of Science Education and Research (IISER), Dr. Homi Bhabha Road, Pashan, Pune 411008, India
6
Kapteyn Astronomical Institute, University of Groningen, PO Box 800, 9700 AV Groningen, The Netherlands
7
Astronomical Observatory, Jagiellonian University, ul. Orla 171, 30–244 Kraków, Poland
8
Anton Pannekoek Institute for Astronomy, University of Amsterdam, Postbus 94249, 1090 GE Amsterdam, The Netherlands
Received:
31
March
2019
Accepted:
3
December
2019
Abstract
Giant radio galaxies (GRGs) are a subclass of radio galaxies, which have grown to megaparsec scales. GRGs are much rarer than normal-sized radio galaxies (< 0.7 Mpc) and the reason for their gigantic sizes is still debated. Here, we report on the biggest sample of GRGs identified to date. These objects were found in the LOFAR Two-metre Sky Survey first data release images, which cover a 424 deg2 region. Of the 239 GRGs found, 225 are new discoveries. The GRGs in our sample have sizes ranging from 0.7 Mpc to 3.5 Mpc and have redshifts (z) between 0.1 and 2.3. Seven GRGs have sizes above 2 Mpc and one has a size of ∼3.5 Mpc. The sample contains 40 GRGs hosted by spectroscopically confirmed quasars. Here, we present the search techniques employed and the resulting catalogue of the newly discovered large sample of GRGs along with their radio properties. In this paper, we also show for the first time that the spectral index of GRGs is similar to that of normal-sized radio galaxies, indicating that most of the GRG population is not dead or is not similar to a remnant-type radio galaxy. We find that 20 out of 239 GRGs in our sample are located at the centres of clusters and we present our analysis on their cluster environment and radio morphology.
Key words: galaxies: jets / galaxies: active / radio continuum: galaxies / quasars: general
The sample of giant radio galaxies is only available at the CDS via anonymous ftp to cdsarc.u-strasbg.fr (130.79.128.5) or via http://cdsarc.u-strasbg.fr/viz-bin/cat/J/A+A/635/A5
© ESO 2020
1. Introduction
A radio galaxy (RG) normally contains a radio core, jets, and lobes powered by an active galactic nucleus (AGN). A RG that has grown to Mpc scales is traditionally defined as a giant radio galaxy (GRG; Willis et al. 1974; Ishwara-Chandra & Saikia 1999). Here, the total size is defined as the largest angular separation between the end of the two radio lobes. This subclass of radio galaxies (RGs) is among the largest single structures known in the Universe along with the cluster radio relics (Rottgering et al. 1997; Bagchi et al. 2006; van Weeren et al. 2011). Born in the active nucleus of a galaxy or a quasar, RGs and quasars eject collimated and bipolar relativistic jets (Lynden-Bell 1969; Begelman et al. 1984). The driving engine for these jets is an accreting supermassive black hole (SMBH) with a typical mass of 108 − 1010M⊙. SMBHs that drive powerful jets reside in elliptical galaxies and only a handful are found in spiral galaxies (Hota et al. 2011; Bagchi et al. 2014).
Morphologically, RGs have been historically divided into two classes, Fanaroff-Riley type I (FR-I) and Fanaroff-Riley type II (FR-II). The lower radio luminosity FR-I sources have their brightest regions closer to the nucleus and their jets fade with distance from the core. For the more powerful FR-II RGs (Fanaroff & Riley 1974), the jet remains relativistic all the way from the central AGN to the hotspots in lobes.
For all RGs the ejection of a collimated jet is dependent on the availability of fuel. Assuming GRGs grow to an enormous size due to a prolonged period activity, this would require either an unusually large reservoir of fuel or a very efficient jet formation mechanism.
Radio galaxies were first discovered about six decades ago (Jennison & Das Gupta 1953) and since then hundreds of thousands of RGs have been found. In contrast to the large number of radio galaxies, only ∼350 GRGs (Dabhade et al. 2017; Kuźmicz et al. 2018, and references therein) have been found of which only a small fraction has been studied in detail. These giants, when associated with quasars as their AGN, are called giant radio quasars (GRQs) and only around 70 GRQs are known so far (Kuźmicz et al. 2018). The term “GRQ” is used here to emphasise the fact that the GRG has quasar as the powering AGN.
The hypotheses proposed to explain the enormous sizes of GRGs are not mutually exclusive and include:
-
1.
GRGs possess exceptionally powerful radio jets, when compared to normal RGs, and these provide the necessary thrust to reach Mpc scales (Wiita et al. 1989).
-
2.
GRGs are very old RGs and have had sufficient time to expand over large distances (Subrahmanyan et al. 1996).
-
3.
GRGs grow in low density environments, (Mack et al. 1998; Malarecki et al. 2015; Saripalli & Malarecki 2015) enabling them to grow comparatively fast.
None of the above hypotheses have been tested using large uniform samples of GRGs. In smaller samples, contradictory results have been found. For example, Mack et al. (1998) found evidence that the ages of GRGs in their sample are similar to that of normal-sized radio galaxies (NRGs), which is contradictory to the second above mentioned point. Also, point three has been contradicted by the findings of Komberg & Pashchenko (2009) and Dabhade et al. (2017) who have reported that a number of GRGs are located in cluster environments.
The exceptionally large lobes of GRGs make them excellent laboratories for studying the evolution of the particle and magnetic field energy density and the acceleration of high-energy cosmic rays. They can also be used to probe large-scale environments (Kronberg et al. 2004; Safouris et al. 2009; Malarecki et al. 2015; Isobe & Koyama 2015).
Until the mid-1990s, GRGs were mostly discovered serendipitously. Only after the advent of deep and large sky radio surveys, such as the Faint Images of the Radio Sky at Twenty-cm (FIRST; Becker et al. 1995), NRAO VLA Sky Survey (NVSS; Condon et al. 1998), Westerbork Northern Sky Survey (WENSS; Rengelink et al. 1997), and Sydney University Molonglo Sky Survey (SUMSS; Bock et al. 1999), were systematic searches for GRGs carried out. Lara et al. (2001), Machalski et al. (2001), and Dabhade et al. (2017) searched the higher frequency survey, such as NVSS (1400 MHz) for GRGs, and Saripalli et al. (2005) used SUMSS, whereas Schoenmakers et al. (2001) used lower frequency surveys, such as WENSS (327 MHz).
The lobes of the GRGs have steep spectral indices and hence are bright at low radio frequencies. Cotter et al. (1996) made a sample of GRGs by using the 151 MHz 7C survey (McGilchrist & Riley 1990). The 7C survey has a low resolution of 70 × 70 cosec (δ) arcsec2 and a noise level ∼15 mJy beam−1 (1σ) and as a consequence contained only a few GRGs. The WENSS has better resolution (54 × 54 cosec (δ) arcsec2) and better sensitivity (rms noise (1σ) ∼3 mJy beam−1) and also covers a somewhat larger area ∼8100 deg2 (7C survey ∼5580 deg2). This enabled Schoenmakers et al. (2001) to compile a large sample of 47 GRGs from the WENSS.
In recent years, four large low frequency surveys have been carried out, namely: the 119−158 MHz Multifrequency Snapshot Sky Survey (MSSS; Heald et al. 2015), the 150 MHz TIFR GMRT SKY SURVEY- Alternative data release-1 (TGSS-ADR1; Intema et al. 2017), the 72−231 MHz GaLactic and Extragalactic All-sky Murchison Widefield Array (GLEAM; Hurley-Walker et al. 2017), and the 120−168 MHz LOFAR Two-metre Sky Survey (LoTSS; Shimwell et al. 2017, 2019).
In the past 20 years, large surveys have also been carried out at optical wavelengths. These surveys include the Sloan Digital Sky Survey (SDSS; York et al. 2000), the 2° Field Galaxy Redshift Survey (2dFGRS; Colless et al. 2001), the 2MASS Redshift Survey (2MRS; Huchra et al. 2012), the 6° Field Galaxy Survey (6dFGS; Jones et al. 2009), and most recently the deep photometric survey called Panoramic Survey Telescope and Rapid Response System (Pan-STARRS; Kaiser et al. 2002, 2010; Chambers et al. 2016). The data from these surveys has allowed for the identification of many new GRGs, as shown in Dabhade et al. (2017).
High sensitivity to low surface brightness features and high spatial resolution to decipher the morphologies are key requirements in identifying GRGs. LoTSS provides a combination of both these properties for the first time and hence by combining it with the SDSS/Pan-STARRS optical surveys, we used it to search for new GRGs in order to form a statistically significant sample. Our study of GRGs will be presented in two papers, where Paper I (this paper) reports on the methodology used for the systematic search scheme implemented for the discovery of new GRGs and GRQs from the LoTSS and presents the sample’s radio properties. The Paper II will focus on the study of the host AGN and galaxy properties of the GRGs and GRQs sample and compare them with another sample (also from LoTSS) of NRGs matched in redshift as well as optical and radio luminosity to the GRG sample.
Throughout the paper, we adopt the flat ΛCDM cosmological model based on the latest Planck results (H0 = 67.8 km s−1 Mpc−1, Ωm = 0.308) (Planck Collaboration XIII 2016), which give a scale of 4.6 kpc/″ for the redshift of 0.3. In this paper, RGs with projected linear sizes ≥0.7 Mpc, which were computed using the above mentioned cosmological parameters are called GRGs. All images are in the J2000 coordinate system. We use the convention Sν ∝ ν−α, where Sν is flux at frequency ν and α is the spectral index.
2. Identifying new GRGs in LoTSS
2.1. The LoTSS first data release
LoTSS is a 120−168 MHz survey, which is being conducted with the high-band antennas (HBA) of LOFAR, will eventually cover the whole northern sky. Hardcastle et al. (2016) have already demonstrated the potential of LoTSS deep observations for discovering GRGs and found seven in the Herschel ATLAS North Galactic Pole survey area (142 deg2). Here, we focus on the LoTSS first data release (LoTSS DR1; Shimwell et al. 2019). The LoTSS DR1 spans (J2000.0 epoch) right ascension from 10h45m to 15h30m and declination from 45° 00′ to 57° 00′ (HETDEX:Hobby-Eberly Telescope Dark Energy Experiment Spring field region), covering an area of 424 deg2 with a median noise level across the mosaic of 71 μJy beam−1 and ∼6″ resolution. In Fig. 1, we see a comparison between the LoTSS and other radio surveys, such as NVSS and FIRST, for a GRG from our sample. The top image (a) is an optical-radio overlay with a blue colour indicating LoTSS low frequency 6″ resolution map on the optical SDSS tri-colour image. In the bottom image (b), the same source is shown as it is observed in NVSS and FIRST. NVSS, though highly sensitive to large-scale diffuse emission, fails to reveal the finer details across the source and cannot properly resolve the core due to its coarser resolution of 45″. The FIRST survey on the other hand has high resolution, which manages to resolve the core and hence helps in identifying the host AGN and galaxy but misses out on almost all the diffuse emission of the lobes and hence it alone cannot be used to identify RGs. The LoTSS data provides with both high resolution as well as high sensitivity and does not resolve out structures revealing finer details of the emission of large-scale jets. Both images (Fig. 1 and source 7 of Fig. A.1) clearly show the radio core and jets feeding the giant radio lobes and the hotspots. This clearly illustrates the excellence of LoTSS and its great potential in unveiling interesting sources.
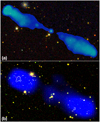 |
Fig. 1. Panel a: colour composite image of 1.86 Mpc long GRG J105817.90+514017.70 made using LoTSS-DR1 144 MHz radio and optical SDSS image. Panel b: colour composite image of the same object with optical and radio overlay, where blue represents 1400 MHz NVSS image with 45″ resolution and white contours from the 1400 MHz FIRST survey having 5″ resolution superimposed on optical SDSS image. The LoTSS 144 MHz 6″ resolution image shown in top panel clearly resolves the core and jet and also highlights the diffuse parts of the lobes, which is missed by the FIRST and unresolved in NVSS. |
By using the LoTSS DR1 radio data and optical-infrared data, a Value Added Catalogue1 (VAC) of 318520 radio sources has been created (Williams et al. 2019; DR1-II). The host galaxies and quasars were identified using the Pan-STARRS and Wide-field Infrared Survey Explorer (WISE; Wright et al. 2010). The Pan-STARRS-AllWISE catalogue was cross matched with the LoTSS survey using a likelihood ratio method. Furthermore, human visual inspection was used for the final classification of complex radio sources employing the LOFAR Galaxy Zoo (LGZ), the details of which are given in Williams et al. (2019; DR1-II). The photometric redshift and rest-frame colour estimates for all hosts, including galaxies and quasars, of the matched radio sources are presented in Duncan et al. (2019; DR1-III). The VAC lists the radio properties, identification methods, and optical properties when available.
2.2. Semi-automated search for GRGs
The methodology of identifying GRGs and forming the final catalogue is presented in a flow chart as seen in Fig. 2 and is described below:
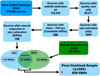 |
Fig. 2. Above figure shows schematics for finding GRGs from LoTSS DR1, using VAC and MVS in steps. More details are presented in Sect. 2. |
1. The VAC of 318520 radio sources was at first refined based on the point source completeness, which is 90% at an integrated flux density of 0.5 mJy for LoTSS DR1 (Shimwell et al. 2019). We applied a flux density cut at this level. This results in the total number of sources reducing to 239845.
2. Only objects with optical identification and redshift estimates were selected, resulting in 162249 sources.
3. The redshift information in the VAC was compiled by mainly using the SDSS spectroscopic data. For the sources that do not have spectroscopic redshift information from the SDSS or any other spectroscopic survey, Duncan et al. (2019) have estimated photometric redshifts by using multi-band photometry. For our work, we imposed a further photometric quality cut on the estimated photometric redshifts. Only sources satisfying the condition Δz/(1 + z) < 0.1 were selected, where Δz is the half-width of the 80% credible interval. This results in a reduction of the sample from 162249 sources to 89671 sources.
4. Williams et al. (2019) inspected all the extended complex radio sources visually via the LGZ programme and estimated the angular size for them. A semi-automated way was adopted for this work by Williams et al. (2019). This resulted in an angular size estimation of a total of 13222 sources in the VAC.
We find that, of the 89671 sources with reliable redshifts, only 4808 sources have angular size estimates by the above mentioned method (LGZ). Or, in other words, 4808 sources have angular size estimates and have passed the photometric quality cut as well (point 3).
5. For all of the 4808 sources, we computed the projected linear size (kpc) and only those that had an extension above 700 kpc were considered for further analysis. This resulted in a sample of 398 candidate GRGs.
6. Further, the candidate GRGs were visually inspected by us in order to identify and remove those with uncertainty in the host, large asymmetry or a high degree of bending, or narrow angle tailed morphology. The angular size measurement was refined by taking the distance between the farthest points of the 3σ contours of the source and the projected linear size was recomputed. We measured the sizes of the sources by using the LoTSS DR1- low-resolution maps (20″) as it shows the entire structure of the GRGs and also does not miss any diffuse emission. The final sample size of GRGs from the VAC is 186 GRGs.
2.3. Manual visual search from LoTSS DR1
An independent manual visual search (MVS) was also carried out to search for GRGs in LoTSS DR1 to look for additional GRGs that were missed in the semi-automated method employed on the VAC. In this approach, all mosaics from LoTSS DR1 were scanned for extended double-lobed structures (candidate GRGs). The radio core of the candidate GRGs were searched in the optical band (SDSS and PAN-STARRS) and infrared (IR) band (WISE) for counterparts (host galaxies). We also used other radio surveys, such as FIRST, TGSS, and WENSS, for additional information and consistency checks. This method (MVS) yielded 53 additional GRGs. These 53 GRGs were missed by the selection criteria because of the photometric redshift cuts we imposed or because the complex nature of the source structures lead them to not be fully characterised in the VAC.
2.4. Final catalogue: VAC and MVS
We combined both GRG samples (VAC and MVS) to form the final GRG catalogue of 239 GRGs (Table A.1). The final catalogue of 239 GRGs was cross matched with the GRG catalogue of Kuźmicz et al. (2018), which is a large compendium of GRGs published until 2018, along with other GRGs reported in the latest research papers. We find only 13 of our 239 GRGs were already known (listed in 13th column of Table A.1). The high-resolution 6″ LoTSS images at 144 MHz of GRGs can be found in Figs. A.1–A.8, where the white contours represent emission seen in the LoTSS low-resolution 20″ map at 144 MHz. The position of the host galaxy is marked with a white cross “+”.
3. Results: The LoTSS catalogue of GRGs
Our search of LoTSS DR1 has enabled us to construct a catalogue2 of 239 GRGs. With the high sensitivity of LoTSS, we are able to detect GRGs as faint as ∼2.5 mJy in total flux at 144 MHz. Using the available optical data and radio data, we have computed the radio powers, spectral indices, and classified the morphological types for the sample of 239 GRGs (Table A.1). The GRGs from our sample have sizes in the range of 0.7 Mpc–∼3.5 Mpc (Fig. 3) with a median size of 0.89 Mpc and a mean size of 1.02 Mpc. GRGs with sizes greater than 2 Mpc are very rare within the GRG population and in our sample we find 7 out of the 239 GRGs to have sizes ≥2 Mpc.
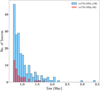 |
Fig. 3. Histogram for sizes of GRGs and GRQs from the LoTSS sample. |
3.1. Optical host properties
The GRGs in our sample span a wide redshift range from 0.1 to 2.3 (Fig. 4). GRGs that are hosted by galaxies are not selected beyond z ∼ 1 due to sensitivity limits of the optical surveys. We used the SDSS DR14 Quasar catalogue (Pâris et al. 2018) and SDSS to identify the GRGs hosted by quasars in our sample. We note that 151 out of 239 GRGs have optical spectroscopic redshifts from SDSS. Of the 151 GRGs with optical spectroscopic redshifts 40 are hosted by quasars (GRQs). Interestingly, based on the available optical data (SDSS and Pan-STARRS) and the Galaxy Zoo catalogue of spiral galaxies (Hart et al. 2016), we find that none of the GRGs is hosted by a spiral galaxy.
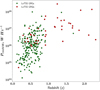 |
Fig. 4. Radio power and redshift distribution for GRGs and GRQs from LoTSS. The two galaxies marked in a green colour with z ≥ 1 are quasar candidates as explained in Sect. 3.4. |
Most of the redshifts of the hosts of GRGs were obtained from the VAC, which has made use of the spectroscopic data from the SDSS and has estimated photometric redshifts for the sources that do not have spectroscopic data in SDSS or in other literature. The uncertainties in the photometric redshifts are explained in Sect. 3 (especially Sect. 3.5) of Duncan et al. (2019).
3.2. Spectral index ( )
)
The LoTSS DR1 provides maps of the radio sky (centred at 144 MHz) at two resolutions, high (6″) and low (20″), which enables us to identify compact cores, jets, and hotspots as well as see the extent of diffuse emission. To compute the flux at 144 MHz, we used the 20″ low-resolution maps of LoTSS DR 1 (Col. 8 of Table A.1). Measurement in the flux errors is done by taking a 20% calibration error for LoTSS DR1 (Shimwell et al. 2019). By combining high frequency (1400 MHz) NVSS and low frequency (144 MHz) LoTSS, we computed the integrated spectral index ( ) for GRGs in our sample (Col. 10 of Table A.1). The NVSS radio map cutouts for GRGs were obtained from its server3 from which we measured the flux of the source.
The following steps were adopted to obtain the spectral index:
– We convolved the LoTSS low-resolution images (cutouts of GRGs from main mosaics) to the same resolution of NVSS (45″) and regridded the LoTSS images to match with NVSS.
– We made automated masks (regions to extract flux) using the package PyBDSF4 (Python Blob Detection and Source Finder) of Mohan & Rafferty (2015).
– The 45″ convolved LoTSS maps were manually inspected for possible contamination (using the high-resolution LoTSS maps (6″) and FIRST’s 5″ maps) from other sources in the field and manual masks were made. The flux was obtained by considering only the region in the manual masks from the automated masks.
– Finally, by using the fluxes obtained from NVSS and LoTSS, the integrated spectral index was computed for the whole source.
A total of 37 out of the 239 sources were contaminated by other nearby radio sources in the low-resolution convolved LoTSS maps and NVSS maps, for these sources (marked with “–” in Col. 10 of Table A.1) a spectral index was not computed. For sources with no detection in NVSS, upper limits on the flux were computed, and a spectral index limit was obtained (indicated with < sign in Col. 10 of Table A.1).
Figure 5 shows the spectral index ( ) distribution of 171 GRGs and 31 GRQs. The median and mean values for spectral index of GRGs are 0.77 and 0.79, respectively. Similarly, for GRQs, the median and mean values are 0.78 and 0.76, respectively. These mean spectral index values of GRGs and GRQs are similar to those of NRGs (Oort et al. 1988; Gruppioni et al. 1997; Kapahi et al. 1998; Ishwara-Chandra et al. 2010; Mahony et al. 2016). In the work of Oort et al. (1988), they surveyed the Lynx field with the Westerbork Synthesis Radio Telescope (WSRT) at 325 MHz and 1400 MHz. Gruppioni et al. (1997) surveyed the Marano field using the Australia Telescope Compact Array (ATCA) at 1.4 GHz and 2.4 GHz. Kapahi et al. (1998) surveyed the Molonglo Radio Catalogue sources with the VLA at L and S bands. Ishwara-Chandra et al. (2010) surveyed the LBDS-Lynx field (LBDS: Leiden-Berkeley Deep Survey) using the 150 MHz band of the Giant Metrewave Radio Telescope and other archival data from GMRT at 610 MHz and 325 MHz along with data from other surveys, such as WENSS, FIRST, and NVSS. Mahony et al. (2016) surveyed the Lockman Hole field using LOFAR 150 MHz and WSRT 1.4 GHz. All the above work obtained spectral index values in the range of ∼0.7−0.8 and therefore the 0.75 value is often assumed as the average spectral index value for RGs in the absence of any multi-frequency observations.
The above mentioned result implies that RGs and GRGs do not differ in terms of their spectral index properties, and most of the GRG population are active RGs and not dead or remnant RGs. The values for the spectral index of GRGs provided by us are integrated values for the whole source and are not just one component of GRGs (such as a core or lobes). It has been found that for some GRGs, the lobes come out to be steeper than usual, which is obtained by multi-frequency (observations at 3 to 4 radio bands) observations of individual sources. There are examples (source number 16, 17, and 193) in our sample where the sources are core dominated (maximum flux observed in radio core) and this, therefore, influences sources to have flatter (less than 0.5) overall spectral index.
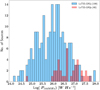 |
Fig. 5. Histogram of Spectral index ( |

3.3. Notes on individual objects
Below, we present brief notes on a selection of some of the most interesting objects in our sample.
3.3.1. Source 5 – GRG J105725.96+492900.31
The host galaxy does not perfectly coincide with the bright core-like feature as they are separated by ∼5″ distance from one another. It is most likely a knot in the jet, which is located right next to a faint radio core. There is neither a galaxy in the immediate vicinity nor any other alternate compact radio emission along the axis of the source, which could possibly be an alternate host of this source.
3.3.2. Source 10 – GRG J110433.11+464225.76
This unusual source has a well detected radio core but does not exhibit any jets or well formed lobes. It has diffuse emission on either side of the radio core and has been reported by Thwala et al. (2019) to be a relic RG with a size of 0.86 Mpc, thereby making it a GRG. Towards the north-western side of the source, there exists an independent FR-II type RG. Using the higher -resolution maps the independent source’s flux was measured and then subtracted from the LoTSS’s low-resolution maps in order to avoid contamination of source fluxes.
3.3.3. Source 44 – GRG J113931.77+472124.3
As seen in Fig. A.2, there is a compact radio source north of the “+” marker (host galaxy-radio core), which is an independent source. Also, the bright compact source seen towards the south-eastern side is independent of the GRG J113931.77+472124.3.
3.3.4. Source 61 – GRG J121555.53+512416.41 and Source 162 – GRG J135628.50+524219.23
These sources are core dominated objects at both low and high frequencies. The lobes of both sources are not detected in NVSS. These are possibly candidates of revived and rejuvenated GRGs as we only observe the diffuse lobes at low frequencies (LoTSS), which could be from the previous epoch. The presence of the bright core may indicate restarting activity.
3.3.5. Source 136 – GRG J133322.79+533250.94
This source displays a peculiar morphology and possibly resides in a unique environment. The VAC estimates its photometric redshift (z) to be 0.3539 ± 0.0344. Lopes (2007) estimated its photometric redshift based on SDSS data to be 0.39301 ± 0.02578. GRG J133322.79+533250.94 is close to two galaxy clusters, namely WHL J133322.0+5333490 at redshift of 0.3938 and WHL J133316.5+533333 at a redshift of 0.3834. Based on the photometric redshift of Lopes (2007), GRG J133322.79+533250.94 is plausibly to be associated with the galaxy cluster WHL J133322.0+5333490 as they are at similar redshifts and are separated by ∼1′. This GRG appears to reside in an environment of a possible merger of two galaxy clusters and the associated radio relic can be seen north of the GRG (Fig. 6).
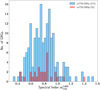 |
Fig. 6. GRG J133322.79+533250.94 possibly amidst galaxy cluster relics. The background image in an orange colour is SDSS I band optical image, which is superimposed with LoTSS DR1 high-resolution (6″) contours. |
3.3.6. Source 161 – GRG J135414.72+491315.2
This GRG exhibits typical FR-II morphology. Interestingly, the radio core coinciding with a faint galaxy is only detected in the FIRST survey.
3.3.7. Source 221 – GRG J145002.36+540528.27
The radio core is well detected in the FIRST survey, which coincides with a galaxy. The source is sufficiently resolved only in the LoTSS high-resolution map as it is located right next to a bright source. The spectral index was computed by estimating an upper limit for the flux from NVSS.
3.3.8. Source 222 – GRG J145057.28+530007.76
The radio core is only resolved in the FIRST survey. It is not symmetrically placed between the two lobes and it is closer to the eastern lobe.
3.3.9. Source 237 – GRG J151835.37+510410.70
The radio core is not symmetrically placed between the two lobes and is closer to the northern lobe. It is also well detected in the FIRST survey. The southern lobe shows a prominent hotspot.
3.4. Giant radio quasars
GRGs with quasars as their AGN (GRQs) are even rarer than the GRGs with non-quasar AGN. Based on the catalogue of Kuźmicz et al. (2018) and the candidates presented by Kuligowska & Kuźmicz (2018), there are currently only ∼70 GRQs known and less than ∼10 GRQs known at z ≥ 2. From our LoTSS sample of 239 GRGs, 40 are confirmed GRQs and two are candidate GRQs (Qc). A total of only six GRQs of the 40 confirmed GRQs were previously reported (Col. 13 in Table A.1) and the rest are all new findings. Our sample of ∼40 GRQs significantly increases the sample of the total GRQs known, at present, from 70 (Kuźmicz et al. 2018) to more than 100. The GRQs in our sample have median and mean radio powers of 6.2 × 1026 W Hz−1 and 2.4 × 1027 W Hz−1 at 144 MHz, respectively, as seen in the histogram distribution of radio powers (Fig. 7).
GRQs J110833.99+483203.03, J123933.21+500708.01, and J133418.63+481317.08 are the three GRQs that we found at a very high redshift of z ≥ 2. They are shown in Fig. 8. GRG J110833.99+483203.03 (16 in Table A.1) is a highly core dominated object at both high as well as low frequencies and hence exhibits a very flat spectral index of ∼0.2. GRGs J132554.31+551936.23 and J141408.45+484156.11 (126 and 178 in Table A.1) have high redshifts and are the two quasar candidates (Qc) as indicated by Richards et al. (2009, 2015). These objects have all the properties of a radio loud quasars but are still candidates because of the absence of an optical spectra. Therefore, they are not labelled as quasars and are not marked in a red colour in any of the figures.
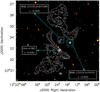 |
Fig. 7. Histogram of radio power at 144 MHz of GRGs and GRQs. |
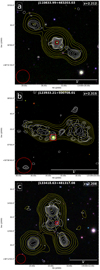 |
Fig. 8. Optical-radio overlay of high redshift (z > 2) GRGs, where the optical images colour composite of three bands of PanSTARRS and radio is from the LoTSS DR-1 at two resolutions. The red square indicates the host of the three GRQs. The white and yellow colour contours represent LoTSS high (6″ × 6″) and low (20″ × 20″; red circles at bottom left) resolution maps, respectively, which have eight equally spaced relative contour levels starting from three times σ, where σ denotes the local rms noise. |
3.5. Environment analysis of GRGs
We used two optically selected galaxy cluster catalogues to identify the host of GRGs with the brightest cluster galaxies (BCGs), which are found to be at the centres of galaxy clusters. We chose the following two catalogues as they are made using SDSS and have an overlap with the HETDEX region, which is common for LoTSS DR1.
Firstly, we used the galaxy cluster catalogue of Wen et al. (2012; hereafter WHL cluster catalogue), which consists of 132,684 clusters. They used photometric data from SDSS-III to find the clusters. This is the biggest galaxy cluster catalogue made using SDSS in the redshift range of 0.05 < z < 0.8 and is ∼95% complete for clusters with a mass of M200 > 1014 M⊙ in the redshift range of 0.05 < z < 0.42. A total of 71 GRGs from our sample fall in this redshift range.
We find 17 GRGs to be BCGs based on the WHL cluster catalogue. We also used the Gaussian Mixture Brightest Cluster Galaxy (GMBCG) catalogue (Hao et al. 2010) consisting of 55 880 galaxy clusters, which is more than 90% complete within the redshift range of 0.1 < z < 0.55. We find three extra GRGs to be BCGs from the GMBCG catalogue. Therefore, we find a total of 20 GRGs (Table A.2) from our sample of 239 to be BCGs residing in dense cluster environments and hosted by BCGs of the clusters. The mass and radius (obtained from Wen et al. 2012) of the 17 clusters are listed in Table A.2.
4. Discussion
4.1. GRGs with sizes > 2 Mpc
GRGs with projected linear sizes > 2 Mpc are quite rare and as observed from Fig. 3, there are only 7 GRGs with sizes greater than 2 Mpc in our sample of 239. Based on a large but incomplete sample compilation of all the currently known GRGs of ∼400 sources, only ∼62 GRGs (∼15%) have sizes greater than 2 Mpc (Willis et al. 1974; Laing et al. 1983; Lacy et al. 1993; Ishwara-Chandra & Saikia 1999; Schoenmakers et al. 2001; Machalski et al. 2001, 2007; Lara et al. 2001; Saripalli et al. 2005; Kozieł-Wierzbowska & Stasińska 2011; Solovyov & Verkhodanov 2014; Amirkhanyan et al. 2015; Amirkhanyan 2016; Dabhade et al. 2017; Clarke et al. 2017; Prescott et al. 2018; Sebastian et al. 2018).
If we take a complete radio sample, such as 3CRR (Laing et al. 1983), then we have only 12 GRGs from the total sample of 173, which is only ∼7% of the total population. Considering this sample of 12 GRGs from 3CRR5, there are only two sources with sizes greater than 2 Mpc, which constitutes ∼17% of the total GRG population in the 3CRR complete sample. The conditions under which a RG grows in order to become a GRG is not very well understood and studies so far based on the observations and theory seem to suggest that the gigantic size could be due to an interplay between the jet power and the environment.
4.2. Morphology of GRGs
Most known GRGs exhibit FR-II-type morphology and we very rarely see RGs with Mpc-scale size with FR-I-type morphology. Based on their morphologies, we classify 18 GRGs as FR-I type and 215 GRGs as FR-II type. GRG J121900.76+505254.41 is the only FR-I GRG residing at cluster centre and hosted by a BCG (Table A.2).
The total radio power of FR-I sources on average is less than that of the FR-II sources (Ledlow & Owen 1996; Lara et al. 2004). As seen in Fig. 9, the FR-I type of GRGs have a limited range in radio power 1024 ∼ 1026 W Hz−1, whereas the FR-II exhibits a wide range of radio powers from 1024 ∼ 1028 W Hz−1 at 144 MHz.
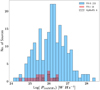 |
Fig. 9. Radio power (144 MHz) distribution of FR-I, FR-II, and HyMoRS souces in LoTSS DR1 sample of giants. |
4.2.1. GRGs with hybrid morphology
Radio galaxies that show FR-I morphology on one side and FR-II morphology on the other side are referred to as HyMoRS (Gopal-Krishna & Wiita 2002). The earliest example of this morphology was presented and studied by Saikia et al. (1996), for the RG 4C +63.07. They attributed this to an intrinsic asymmetry in either the collimation of its jets or the supply of fuel from the central black hole to the opposite sides.
Gawroński et al. (2006) estimated the occurrence of HyMoRS to be as low as ≤1% amongst the RG population. Recently, Kapińska et al. (2017) presented 25 new candidate HyMoRS, of which five are GRGs with one being at the centre of a galaxy cluster. Therefore, one of the possible scenarios for such hybrid morphology could be attributed to different environments on each side of the host galaxy (radio core).
In our sample of 239 GRGs, we find six examples of HyMoRS (identified via visual inspection), which are listed in Col. 11 (FR type) of Table A.1 and indicated with the roman numeral III, images of these sources are presented in Fig. 10. This is by far the largest HyMoRS GRG sample to have ever been reported. Environment, as well as host AGN studies, are needed to understand this class of RGs, which can also grow to megaparsec scales in size.
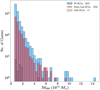 |
Fig. 10. LoTSS DR1 (6″ × 6″) maps of 6 HyMoRS in inverted blue colour scale with (20″ × 20″) black contours (eight equally spaced relative contour levels starting from three times σ, where σ denotes the local rms noise). The circles at bottom left corner represents the beam sizes of low-resolution radio maps of LoTSS DR1. The red colour marker “+” indicates the location of the host galaxy. |
4.2.2. DDRGs: Double double radio galaxies
DDRG are FR-II-type objects with two pairs of lobes, which is indicative of their restarted nature (Schoenmakers et al. 2000; Saikia & Jamrozy 2009). The newly created jets in such sources travel outwards through the cocoon formed by the earlier cycle and episode of activity rather than the common intergalactic or intracluster medium, after moving through the interstellar medium of the host galaxy. In general, the outer double lobes are aligned with the inner ones and can extend from a few kpc up to Mpc scales. It is likely that in DDRGs, due to an unknown mechanism or activity, the interruption of these bipolar relativistic jet flows has occurred leading to such morphologies.
In the last approximately 20 years only about 140 DDRGs have been reported (Schoenmakers et al. 2000; Nandi & Saikia 2012; Kuźmicz et al. 2017; Mahatma et al. 2019; Nandi et al. 2019). Recently, (Mahatma et al. 2019) created a new sample of 33 DDRGs using the LoTSS DR1 and follow-up observations at higher frequency with the Jansky Very Large Array (JVLA), where they compared the optical and IR magnitudes and colours of their host galaxies with a sample of normal RGs. They find that the host galaxy properties of both DDRGs and normal radio galaxies are similar and suggest that the DDRG activity is a regular part of the life cycle of the RGs. We have found only 14 GRGs, which is currently the largest sample reported, in our entire sample with a DDRG-type morphology as seen in Figs. 11 and 12, indicating that megaparsec-scale DDRGs are rare. Except J110457.07+480913, J110613.55+485748.29, J121900.76+505254.41, J123754.05+512201.28, J134313.31+560008.35, and J141504.70+463428.97, the remaining eight were previously classified as DDRGs in the literature (seven in Mahatma et al. 2019 and GRG J140718.48+513204.63 in Nandi & Saikia 2012).
We note that sources 28 (GRG JJ112130.35+494208.14) and 221 (GRG J145002.36+540528.27) show some signs of being DDRGs but based on the current radio maps available to us, they cannot be confirmed as DDRGs and hence are candidate DDRGs. Deep and higher resolution observations at higher frequencies (> 1 GHz) are required to confirm the exact nature of candidate DDRGs.
These sources provide a unique opportunity to study the timescales of AGN recurrent activity. As seen in Figs. 11–13, some components of the giant DDRGs are very faint and it was only possible with LoTSS’s high sensitivity and resolution to detect and sufficiently resolve them. Further studies on host AGN and galaxy properties of DDRGs along with their local environments are needed to understand these peculiar sources better.
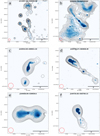 |
Fig. 11. DDRGs postage-1 (1–6 DDRGs) made using LoTSS DR1 144 MHz radio image with 6″ × 6″ resolution in inverted blue colour scale. Refer to Sect. 4.2.2 for more details. The circle at bottom left corner represents the beam size. The red colour marker “+” indicates the location of the host galaxy. In source J110613.55+485748.29 (sub-image c), the two red markers indicate the inner pair of the DDRG and the black markers indicate the outer pair of the DDRG. |
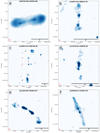 |
Fig. 12. DDRGs postage-1 (7–12 DDRGs) made using LoTSS DR1 144 MHz radio image with 6″ × 6″ resolution in inverted blue colour scale. Refer to Sect. 4.2.2 for more details. |
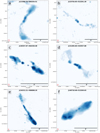 |
Fig. 13. DDRGs postage-1 (13–14 DDRGs) made using LoTSS DR1 144 MHz radio image with 6″ × 6″ resolution in inverted blue colour scale. Refer to Sect. 4.2.2 for more details. |
4.3. GRGs in dense environments
It has been hypothesised that the growth of GRGs to enormous size is favoured by their location in low density environments. Using our large new sample of GRGs, it is now possible to test this hypothesis for objects with low redshifts (z < 0.55). We find that at least 8.4% of GRGs (Table A.2) from our sample (20 out of 239) are located in high density environments and are hosted by BCGs. This low number of BCG GRGs is possibly due to the absence of data for high redshift clusters in the WHL cluster catalogue and GMBCG catalogue, which are more sensitive to clusters with a redshift less than ∼0.42 and ∼0.55, respectively (see Sect. 3.5). We have 128 GRGs with z ≤ 0.55, therefore at least ∼16% (20 out of 128) GRGs are in dense cluster environments. Based on the work of Paul et al. (2017), virialised structures of mass M200 ≥ 0.8 × 10¹⁴M⊙ are classified as a cluster of galaxies and non-virialised gravitionally bound structures consisting of few galaxies with M200 < 0.8 × 10¹⁴M⊙ are classified as a group of galaxies. By using this classification, there are 14 GRGs in clusters and 3 GRGs in groups of galaxies (see Table A.2).
Croston et al. (2019) carried out a study of environments of ∼8000 radio loud AGNs from the LoTSS, where they find that only 10% of AGNs are associated with high density environments, similar to galaxy groups and clusters as well as AGNs with L150 > 1025 W Hz−1 (where L150 is the radio power at 150 MHz), and are more likely to be in cluster environments. Similarly, our 20 BCG GRGs, which are also radio loud AGNs in galaxy cluster, exhibit P144 MHz or L150 > 1025 W Hz−1.
To compare the properties of galaxy clusters that have radio loud BCGs (also BCG-GRGs) and the galaxy clusters with radio quiet BCGs, we extracted all the galaxy clusters present in the LoTSS-DR1 HETDEX region from the WHL cluster catalogue. This resulted in a total of 5027 galaxy clusters below redshift (z) of 0.55 (highest redshift of BCG-GRG in our sample). Next, we cross-matched the location of BCGs (5027) from the WHL cluster with the VAC and FIRST catalogue to determine all the radio loud BCGs in this region. The final number of galaxy clusters with radio loud BCGs is 1559 (unique sample after combining the results from matches with VAC and FIRST). The 1559 radio loud BCGs also include our 17 BCG-GRGs (found in WHL; see Table A.2). In Fig. 14, we show the distribution of M200 of clusters of galaxies, where M200 is the mass of the cluster within r200, and r200 is the radius within which the mean density of a cluster is 200 times the critical density of the Universe. We note that about 30% (1541) clusters have radio loud BCGs that are not giants and only ∼0.34% of the clusters in WHL cluster catalogue (HETDEX region) host a GRG (or have BCG GRG). Though the GRG sample is less here but more or less complete, it seems that GRGs that are BCGs tend to avoid very high mass clusters and prefer less dense clusters.
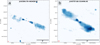 |
Fig. 14. Distribution of M200 (mass of the cluster within r200) of clusters of galaxies. |
The BCG GRGs can also possibly trace the inhomogeneities in the intergalactic gas, which could be one of the determining factors for the growth and evolution of these giant sources. The forward propagation of jets as well as the backflow from hotspots in the lobes of GRGs are influenced by the gas they encounter. Only 1 out of 20 BCG GRGs in our sample have FR-I-type radio morphology and the remaining 19 have FR-II-type radio morphology. Almost all of these sources do not exhibit highly linear structures, but they are distorted or bent to a certain extent, which indicates the effect of interaction between the cluster medium and the expanding radio jets of the BCG GRGs. Remarkably, despite the possible resistance presented by the cluster medium, these sources have managed to grow to megaparsec scales. This seems to suggest the presence of an extraordinarily powerful AGN powering these sources.
5. Summary
A total of 239 GRGs (Table 1) were found in ∼424 deg2 area using LoTSS, which is just ∼2% of the area of the total survey that is planned to cover the northern sky. The summary of the paper is as follows.
Short summary of classification of GRGs.
-
1.
Our sample of 239 GRGs is in the redshift range of 0.1−2.3, out of which 225 are newly found. This makes it the largest sample discovered to date.
-
2.
About 16% (40 out of 239) of the sample are hosted by quasars, where three GRQs are above a redshift of 2.
-
3.
The depth and resolution of LoTSS images has enabled us to find GRGs with low powers of ∼1024 W Hz−1 at 144 MHz.
-
4.
We show that the spectral index of GRGs and GRQs is similar to that of their low-sized counterparts (NRGs).
-
5.
The majority (90%) of our sample show FR-II-type morphology.
-
6.
We found 14 double-double GRGs, which is ∼5% of our sample. It is currently the largest reporting sample of giant DDRGs.
-
7.
We have found 6 GRGs with HyMoRS morphology, which is very rare.
-
8.
Based on the optical data, we find that none of the GRGs in our sample are hosted by spiral galaxies.
-
9.
At z < 0.55, at least ∼16% of GRGs lie at the centres (BCGs) of either big galaxy groups or galaxy clusters.
Our sample of 239 GRGs represents a lower number estimate due to the limitation of optical data, which is essential for identifying a host galaxy and its corresponding redshift. Assuming the isotropy and homogeneity of the Universe, if we extrapolate the number of GRGs expected to be found over the final sky coverage of LoTSS (∼2π steradians), then we should be able to find at least ∼12 000 GRGs with LoTSS’s sensitivity. Upcoming deep optical spectroscopic surveys, such as the WEAVE-LOFAR survey (Smith et al. 2016), will provide crucial data (redshifts) for identifying hundreds or more GRGs.
Before the precise measurement of H0, originally GRGs were defined as RGs with projected linear sizes ≥1 Mpc using H0 = 50 km s−1 Mpc−1. If we convert the original definition with the latest precise measurement of H0 = 67.8 km s−1 Mpc−1 with Ωm = 0.308, then the lower limit of the projected linear size of GRGs is ∼0.74 Mpc. In our sample, 28 GRGs have projected linear sizes between 0.7 Mpc and 0.74 Mpc.
Acknowledgments
We acknowledge the comments and suggestions of the anonymous referee which has helped us improve the quality of our paper. PD and JB gratefully acknowledge generous support from the Indo-French Center for the Promotion of Advanced Research (Centre Franco-Indien pour la Promotion de la Recherche Avanćee) under programme no. 5204-2 and thank IUCAA and IUCAA Radio Physics Lab (RPL) for financial and logistic support. This research has made use of the Dutch national e-infrastructure with support of the SURF Cooperative (e-infra 180169) and the LOFAR e-infra group. The Jülich LOFAR Long Term Archive and the German LOFAR network, are both co-ordinated and operated by the Jülich Supercomputing Centre (JSC), and computing resources on the Supercomputer JUWELS at JSC were provided by the Gauss Centre for Supercomputing e.V. ( www.gauss-centre.eu, grant CHTB00) through the John von Neumann Institute for Computing (NIC). HJR gratefully acknowledge generous support from the European Research Council under the European Unions Seventh Framework Programme (FP/2007-2013)/ERC Advanced Grant NEWCLUSTERS-321271. MJH acknowledges support from the UK Science and Technology Facilities Council [ST/R000905/1]. This research has made use of the University of Hertfordshire high-performance computing facility (https://uhhpc.herts.ac.uk/) and the LOFAR-UK compute facility, located at the University of Hertfordshire and supported by STFC [ST/P000096/1]. HJR and KJD acknowledges support from the ERC Advanced Investigator programme NewClusters 321271. LOFAR, the Low Frequency Array designed and constructed by ASTRON, has facilities in several countries, which are owned by various parties (each with their own funding), and are collectively operated by the International LOFAR Telescope (ILT) foundation under a joint scientific policy. We thank the LOFAR Galaxy Zoo team. We gratefully acknowledge the use of Edward (Ned) Wright’s online Cosmology Calculator. This research has made use of the NASA Extragalactic Database (NED) which is operated by the Jet Propulsion Laboratory, California Institute of Technology, under contract with the National Aeronautics and Space Administration. This research has also made use of the SIMBAD database, operated at CDS, Strasbourg, France. This publication makes use of data products from the Wide-field Infrared Survey Explorer, which is a joint project of the University of California, Los Angeles, and the Jet Propulsion Laboratory/California Institute of Technology, funded by the National Aeronautics and Space Administration.
References
- Amirkhanyan, V. R. 2016, Astrophys. Bull., 71, 384 [NASA ADS] [CrossRef] [Google Scholar]
- Amirkhanyan, V. R., Afanasiev, V. L., & Moiseev, A. V. 2015, Astrophys. Bull., 70, 45 [NASA ADS] [CrossRef] [Google Scholar]
- Bagchi, J., Durret, F., Neto, G. B. L., & Paul, S. 2006, Science, 314, 791 [NASA ADS] [CrossRef] [PubMed] [Google Scholar]
- Bagchi, J., Vivek, M., Vikram, V., et al. 2014, ApJ, 788, 174 [NASA ADS] [CrossRef] [Google Scholar]
- Becker, R. H., White, R. L., & Helfand, D. J. 1995, ApJ, 450, 559 [NASA ADS] [CrossRef] [Google Scholar]
- Begelman, M. C., Blandford, R. D., & Rees, M. J. 1984, Rev. Mod. Phys., 56, 255 [NASA ADS] [CrossRef] [Google Scholar]
- Bock, D. C.-J., Large, M. I., & Sadler, E. M. 1999, AJ, 117, 1578 [NASA ADS] [CrossRef] [Google Scholar]
- Chambers, K. C., Magnier, E. A., Metcalfe, N., et al. 2016, ArXiv e-prints [arXiv:1612.05560] [Google Scholar]
- Clarke, A. O., Heald, G., Jarrett, T., et al. 2017, A&A, 601, A25 [NASA ADS] [CrossRef] [EDP Sciences] [Google Scholar]
- Colless, M., Dalton, G., Maddox, S., et al. 2001, MNRAS, 328, 1039 [NASA ADS] [CrossRef] [Google Scholar]
- Condon, J. J., Cotton, W. D., Greisen, E. W., et al. 1998, AJ, 115, 1693 [NASA ADS] [CrossRef] [Google Scholar]
- Cotter, G., Rawlings, S., & Saunders, R. 1996, MNRAS, 281, 1081 [NASA ADS] [CrossRef] [Google Scholar]
- Croston, J. H., Hardcastle, M. J., Mingo, B., et al. 2019, A&A, 622, A10 [NASA ADS] [CrossRef] [EDP Sciences] [Google Scholar]
- Dabhade, P., Gaikwad, M., Bagchi, J., et al. 2017, MNRAS, 469, 2886 [NASA ADS] [CrossRef] [Google Scholar]
- Duncan, K. J., Sabater, J., Röttgering, H. J. A., et al. 2019, A&A, 622, A3 [NASA ADS] [CrossRef] [EDP Sciences] [Google Scholar]
- Fanaroff, B. L., & Riley, J. M. 1974, MNRAS, 167, 31P [Google Scholar]
- Gawroński, M. P., Marecki, A., Kunert-Bajraszewska, M., & Kus, A. J. 2006, A&A, 447, 63 [NASA ADS] [CrossRef] [EDP Sciences] [Google Scholar]
- Gopal-Krishna, & Wiita, P. J. 2002, New Astron. Rev., 46, 357 [NASA ADS] [CrossRef] [Google Scholar]
- Gruppioni, C., Zamorani, G., de Ruiter, H. R., et al. 1997, MNRAS, 286, 470 [NASA ADS] [CrossRef] [Google Scholar]
- Hao, J., McKay, T. A., Koester, B. P., et al. 2010, ApJS, 191, 254 [NASA ADS] [CrossRef] [Google Scholar]
- Hardcastle, M. J., Gürkan, G., van Weeren, R. J., et al. 2016, MNRAS, 462, 1910 [NASA ADS] [CrossRef] [Google Scholar]
- Hart, R. E., Bamford, S. P., Willett, K. W., et al. 2016, MNRAS, 461, 3663 [NASA ADS] [CrossRef] [Google Scholar]
- Heald, G. H., Pizzo, R. F., Orrú, E., et al. 2015, A&A, 582, A123 [NASA ADS] [CrossRef] [EDP Sciences] [Google Scholar]
- Hota, A., Sirothia, S. K., Ohyama, Y., et al. 2011, MNRAS, 417, L36 [NASA ADS] [CrossRef] [Google Scholar]
- Huchra, J. P., Macri, L. M., Masters, K. L., et al. 2012, ApJS, 199, 26 [NASA ADS] [CrossRef] [Google Scholar]
- Hurley-Walker, N., Callingham, J. R., Hancock, P. J., et al. 2017, MNRAS, 464, 1146 [NASA ADS] [CrossRef] [Google Scholar]
- Intema, H. T., Jagannathan, P., Mooley, K. P., & Frail, D. A. 2017, A&A, 598, A78 [NASA ADS] [CrossRef] [EDP Sciences] [Google Scholar]
- Ishwara-Chandra, C. H., & Saikia, D. J. 1999, MNRAS, 309, 100 [NASA ADS] [CrossRef] [Google Scholar]
- Ishwara-Chandra, C. H., Sirothia, S. K., Wadadekar, Y., et al. 2010, MNRAS, 405, 436 [NASA ADS] [Google Scholar]
- Isobe, N., & Koyama, S. 2015, PASJ, 67, 77 [NASA ADS] [CrossRef] [Google Scholar]
- Jennison, R. C., & Das Gupta, M. K. 1953, Nature, 172, 996 [NASA ADS] [CrossRef] [Google Scholar]
- Jones, D. H., Read, M. A., Saunders, W., et al. 2009, MNRAS, 399, 683 [NASA ADS] [CrossRef] [Google Scholar]
- Kaiser, N., Aussel, H., Burke, B. E., et al. 2002, Proc. SPIE, 4836, 154 [NASA ADS] [CrossRef] [Google Scholar]
- Kaiser, N., Burgett, W., Chambers, K., et al. 2010, Proc. SPIE, 7733, 77330E [Google Scholar]
- Kapahi, V. K., Athreya, R. M., van Breugel, W., et al. 1998, ApJS, 118, 275 [NASA ADS] [CrossRef] [Google Scholar]
- Kapińska, A. D., Terentev, I., Wong, O. I., et al. 2017, AJ, 154, 253 [NASA ADS] [CrossRef] [Google Scholar]
- Komberg, B. V., & Pashchenko, I. N. 2009, Astron. Rep., 53, 1086 [NASA ADS] [CrossRef] [Google Scholar]
- Kozieł-Wierzbowska, D., & Stasińska, G. 2011, MNRAS, 415, 1013 [NASA ADS] [CrossRef] [Google Scholar]
- Kronberg, P. P., Colgate, S. A., Li, H., & Dufton, Q. W. 2004, ApJ, 604, L77 [NASA ADS] [CrossRef] [Google Scholar]
- Kuligowska, E., & Kuźmicz, A. 2018, XXXVIII Polish Astronomical Society Meeting, 82 [Google Scholar]
- Kuźmicz, A., Jamrozy, M., Kozieł-Wierzbowska, D., et al. 2017, MNRAS, 471, 3806 [NASA ADS] [CrossRef] [Google Scholar]
- Kuźmicz, A., Jamrozy, M., Bronarska, K., et al. 2018, ApJS, 238, 9 [NASA ADS] [CrossRef] [Google Scholar]
- Lacy, M., Rawlings, S., Saunders, R., et al. 1993, MNRAS, 264, 721 [NASA ADS] [CrossRef] [Google Scholar]
- Laing, R. A., Riley, J. M., & Longair, M. S. 1983, MNRAS, 204, 151 [Google Scholar]
- Lara, L., Cotton, W. D., Feretti, L., et al. 2001, A&A, 370, 409 [NASA ADS] [CrossRef] [EDP Sciences] [Google Scholar]
- Lara, L., Giovannini, G., Cotton, W. D., et al. 2004, A&A, 421, 899 [NASA ADS] [CrossRef] [EDP Sciences] [Google Scholar]
- Ledlow, M. J., & Owen, F. N. 1996, AJ, 112, 9 [NASA ADS] [CrossRef] [Google Scholar]
- Lopes, P. A. A. 2007, MNRAS, 380, 1608 [NASA ADS] [CrossRef] [Google Scholar]
- Lynden-Bell, D. 1969, Nature, 223, 690 [NASA ADS] [CrossRef] [Google Scholar]
- Machalski, J. 1998, A&AS, 128, 153 [NASA ADS] [CrossRef] [EDP Sciences] [Google Scholar]
- Machalski, J., Jamrozy, M., & Zola, S. 2001, A&A, 371, 445 [NASA ADS] [CrossRef] [EDP Sciences] [Google Scholar]
- Machalski, J., Koziel-Wierzbowska, D., & Jamrozy, M. 2007, Acta Astron., 57, 227 [NASA ADS] [Google Scholar]
- Mack, K.-H., Klein, U., O’Dea, C. P., Willis, A. G., & Saripalli, L. 1998, A&A, 329, 431 [NASA ADS] [Google Scholar]
- Mahatma, V. H., Hardcastle, M. J., Williams, W. L., et al. 2019, A&A, 622, A13 [NASA ADS] [CrossRef] [EDP Sciences] [Google Scholar]
- Malarecki, J. M., Jones, D. H., Saripalli, L., Staveley-Smith, L., & Subrahmanyan, R. 2015, MNRAS, 449, 955 [NASA ADS] [CrossRef] [Google Scholar]
- McGilchrist, M. M., & Riley, J. M. 1990, MNRAS, 246, 123 [NASA ADS] [Google Scholar]
- Mohan, N., & Rafferty, D. 2015, Astrophysics Source Code Library [record ascl:1502.007] [Google Scholar]
- Mahony, E. K., Morganti, R., Prandoni, I., et al. 2016, MNRAS, 463, 2997 [NASA ADS] [CrossRef] [Google Scholar]
- Nandi, S., & Saikia, D. J. 2012, Bull. Astron. Soc. India, 40, 121 [NASA ADS] [Google Scholar]
- Nandi, S., Saikia, D. J., Roy, R., et al. 2019, MNRAS, 486, 5158 [NASA ADS] [CrossRef] [Google Scholar]
- Nilsson, K. 1998, A&AS, 132, 31 [NASA ADS] [CrossRef] [EDP Sciences] [Google Scholar]
- Oort, M. J. A., Steemers, W. J. G., & Windhorst, R. A. 1988, A&AS, 73, 103 [NASA ADS] [Google Scholar]
- O’Sullivan, S. P., Machalski, J., Van Eck, C. L., et al. 2019, A&A, 622, A16 [NASA ADS] [CrossRef] [EDP Sciences] [Google Scholar]
- Pâris, I., Petitjean, P., Aubourg, É., et al. 2018, A&A, 613, A51 [NASA ADS] [CrossRef] [EDP Sciences] [Google Scholar]
- Paul, S., John, R. S., Gupta, P., & Kumar, H. 2017, MNRAS, 471, 2 [NASA ADS] [CrossRef] [Google Scholar]
- Planck Collaboration XIII. 2016, A&A, 594, A13 [NASA ADS] [CrossRef] [EDP Sciences] [Google Scholar]
- Prescott, M., Whittam, I. H., Jarvis, M. J., et al. 2018, MNRAS, 480, 707 [NASA ADS] [CrossRef] [Google Scholar]
- Richards, G. T., Myers, A. D., Gray, A. G., et al. 2009, ApJS, 180, 67 [NASA ADS] [CrossRef] [Google Scholar]
- Richards, G. T., Myers, A. D., Peters, C. M., et al. 2015, ApJS, 219, 39 [NASA ADS] [CrossRef] [Google Scholar]
- Rengelink, R. B., Tang, Y., de Bruyn, A. G., et al. 1997, A&AS, 124, 259 [NASA ADS] [CrossRef] [EDP Sciences] [Google Scholar]
- Rentería Macario, J., & Andernach, H. 2017, ArXiv e-prints [arXiv:1710.10731] [Google Scholar]
- Rottgering, H. J. A., Wieringa, M. H., Hunstead, R. W., & Ekers, R. D. 1997, MNRAS, 290, 577 [NASA ADS] [CrossRef] [Google Scholar]
- Saikia, D. J., & Jamrozy, M. 2009, Bull. Astron. Soc. India, 37, 63 [NASA ADS] [Google Scholar]
- Saikia, D. J., Thomasson, P., Jackson, N., Salter, C. J., & Junor, W. 1996, MNRAS, 282, 837 [NASA ADS] [CrossRef] [Google Scholar]
- Safouris, V., Subrahmanyan, R., Bicknell, G. V., & Saripalli, L. 2009, MNRAS, 393, 2 [NASA ADS] [CrossRef] [Google Scholar]
- Saripalli, L., & Malarecki, J. M. 2015, The Many Facets of Extragalactic Radio Surveys: Towards New Scientific Challenges, 44 [Google Scholar]
- Saripalli, L., Hunstead, R. W., Subrahmanyan, R., & Boyce, E. 2005, AJ, 130, 896 [NASA ADS] [CrossRef] [Google Scholar]
- Schoenmakers, A. P., de Bruyn, A. G., Röttgering, H. J. A., van der Laan, H., & Kaiser, C. R. 2000, MNRAS, 315, 371 [NASA ADS] [CrossRef] [Google Scholar]
- Schoenmakers, A. P., de Bruyn, A. G., Röttgering, H. J. A., & van der Laan, H. 2001, A&A, 374, 861 [NASA ADS] [CrossRef] [EDP Sciences] [Google Scholar]
- Sebastian, B., Ishwara-Chandra, C. H., Joshi, R., et al. 2018, MNRAS, 473, 4926 [NASA ADS] [CrossRef] [Google Scholar]
- Shimwell, T. W., Röttgering, H. J. A., Best, P. N., et al. 2017, A&A, 598, A104 [NASA ADS] [CrossRef] [EDP Sciences] [Google Scholar]
- Shimwell, T. W., Tasse, C., Hardcastle, M. J., et al. 2019, A&A, 622, A1 [NASA ADS] [CrossRef] [EDP Sciences] [Google Scholar]
- Smith, D. J. B., Best, P. N., Duncan, K. J., et al. 2016, SF2A-2016: Proceedings of the Annual Meeting of the French Society of Astronomy and Astrophysics, 271 [Google Scholar]
- Solovyov, D. I., & Verkhodanov, O. V. 2014, Astrophys. Bull., 69, 141 [NASA ADS] [CrossRef] [Google Scholar]
- Subrahmanyan, R., Saripalli, L., & Hunstead, R. W. 1996, MNRAS, 279, 257 [NASA ADS] [CrossRef] [Google Scholar]
- Thwala, S. A., Shafi, N., Colafrancesco, S., et al. 2019, MNRAS, 485, 1938 [NASA ADS] [Google Scholar]
- van Weeren, R. J., Brüggen, M., Röttgering, H. J. A., et al. 2011, A&A, 533, A35 [NASA ADS] [CrossRef] [EDP Sciences] [Google Scholar]
- Wen, Z. L., Han, J. L., & Liu, F. S. 2012, ApJS, 199, 34 [NASA ADS] [CrossRef] [Google Scholar]
- Wiita, P. J., Rosen, A., Gopal-Krishna, & Saripalli, L. 1989, Hot Spots in Extragalactic Radio Sources, 327, 173 [NASA ADS] [CrossRef] [Google Scholar]
- Williams, W. L., Hardcastle, M. J., Best, P. N., et al. 2019, A&A, 622, A2 [NASA ADS] [CrossRef] [EDP Sciences] [Google Scholar]
- Willis, A. G., Strom, R. G., & Wilson, A. S. 1974, Nature, 250, 625 [NASA ADS] [CrossRef] [Google Scholar]
- Wright, E. L., Eisenhardt, P. R. M., Mainzer, A. K., et al. 2010, AJ, 140, 1868 [NASA ADS] [CrossRef] [Google Scholar]
- York, D. G., Adelman, J., Anderson, Jr., J. E., et al. 2000, AJ, 120, 1579 [CrossRef] [Google Scholar]
Appendix A: Additional tables and figures
239 GRGs found from the LoTSS.
LoTSS GRGs in galaxy clusters.
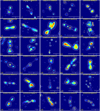 |
Fig. A.1. LoTSS high-resolution (∼6″) images 1–30 with LoTSS low-resolution (∼20″) contours overlaid. The cross “+” marker indicates the location of the host galaxy. The radio contours are drawn with eight levels, which are chosen by equally (log scale) dividing the data value range above ∼3σ, where σ is the local rms of the map. |
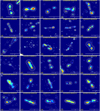 |
Fig. A.2. LoTSS high-resolution (∼6″) images 31–60 with LoTSS low-resolution (∼20″) contours overlaid. The cross “+” marker indicates the location of the host galaxy. The radio contours are drawn with eight levels, which are chosen by equally (log scale) dividing the data value range above ∼3σ, where σ is the local rms of the map. |
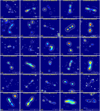 |
Fig. A.3. LoTSS high-resolution (∼6″) images 61–90 with LoTSS low-resolution (∼20″) contours overlaid. The cross “+” marker indicates the location of the host galaxy. The radio contours are drawn with eight levels, which are chosen by equally (log scale) dividing the data value range above ∼3σ, where σ is the local rms of the map. |
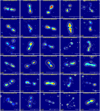 |
Fig. A.4. LoTSS high-resolution (∼6″) images 91–120 with LoTSS low-resolution (∼20″) contours overlaid. The cross “+” marker indicates the location of the host galaxy. The radio contours are drawn with eight levels, which are chosen by equally (log scale) dividing the data value range above ∼3σ, where σ is the local rms of the map. |
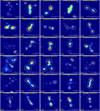 |
Fig. A.5. LoTSS high-resolution (∼6″) images 121–150 with LoTSS low-resolution (∼20″) contours overlaid. The cross “+” marker indicates the location of the host galaxy. The radio contours are drawn with eight levels, which are chosen by equally (log scale) dividing the data value range above ∼3σ, where σ is the local rms of the map. |
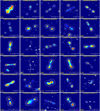 |
Fig. A.6. LoTSS high-resolution (∼6″) images 151–180 with LoTSS low-resolution (∼20″) contours overlaid. The cross “+” marker indicates the location of the host galaxy. The radio contours are drawn with eight levels, which are chosen by equally (log scale) dividing the data value range above ∼3σ, where σ is the local rms of the map. |
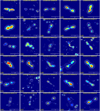 |
Fig. A.7. LoTSS high-resolution (∼6″) images 181–210 with LoTSS low-resolution (∼20″) contours overlaid. The cross “+” marker indicates the location of the host galaxy. The radio contours are drawn with eight levels, which are chosen by equally (log scale) dividing the data value range above ∼3σ, where σ is the local rms of the map. |
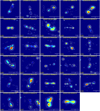 |
Fig. A.8. LoTSS high-resolution (∼6″) images 211–239 with LoTSS low-resolution (∼20″) contours overlaid. The cross “+” marker indicates the location of the host galaxy. The radio contours are drawn with eight levels, which are chosen by equally (log scale) dividing the data value range above ∼3σ, where σ is the local rms of the map. |
All Tables
All Figures
|
Fig. 1. Panel a: colour composite image of 1.86 Mpc long GRG J105817.90+514017.70 made using LoTSS-DR1 144 MHz radio and optical SDSS image. Panel b: colour composite image of the same object with optical and radio overlay, where blue represents 1400 MHz NVSS image with 45″ resolution and white contours from the 1400 MHz FIRST survey having 5″ resolution superimposed on optical SDSS image. The LoTSS 144 MHz 6″ resolution image shown in top panel clearly resolves the core and jet and also highlights the diffuse parts of the lobes, which is missed by the FIRST and unresolved in NVSS. |
| In the text | |
|
Fig. 2. Above figure shows schematics for finding GRGs from LoTSS DR1, using VAC and MVS in steps. More details are presented in Sect. 2. |
| In the text | |
|
Fig. 3. Histogram for sizes of GRGs and GRQs from the LoTSS sample. |
| In the text | |
|
Fig. 4. Radio power and redshift distribution for GRGs and GRQs from LoTSS. The two galaxies marked in a green colour with z ≥ 1 are quasar candidates as explained in Sect. 3.4. |
| In the text | |
|
Fig. 5. Histogram of Spectral index ( |
| In the text | |
|
Fig. 6. GRG J133322.79+533250.94 possibly amidst galaxy cluster relics. The background image in an orange colour is SDSS I band optical image, which is superimposed with LoTSS DR1 high-resolution (6″) contours. |
| In the text | |
|
Fig. 7. Histogram of radio power at 144 MHz of GRGs and GRQs. |
| In the text | |
|
Fig. 8. Optical-radio overlay of high redshift (z > 2) GRGs, where the optical images colour composite of three bands of PanSTARRS and radio is from the LoTSS DR-1 at two resolutions. The red square indicates the host of the three GRQs. The white and yellow colour contours represent LoTSS high (6″ × 6″) and low (20″ × 20″; red circles at bottom left) resolution maps, respectively, which have eight equally spaced relative contour levels starting from three times σ, where σ denotes the local rms noise. |
| In the text | |
|
Fig. 9. Radio power (144 MHz) distribution of FR-I, FR-II, and HyMoRS souces in LoTSS DR1 sample of giants. |
| In the text | |
|
Fig. 10. LoTSS DR1 (6″ × 6″) maps of 6 HyMoRS in inverted blue colour scale with (20″ × 20″) black contours (eight equally spaced relative contour levels starting from three times σ, where σ denotes the local rms noise). The circles at bottom left corner represents the beam sizes of low-resolution radio maps of LoTSS DR1. The red colour marker “+” indicates the location of the host galaxy. |
| In the text | |
|
Fig. 11. DDRGs postage-1 (1–6 DDRGs) made using LoTSS DR1 144 MHz radio image with 6″ × 6″ resolution in inverted blue colour scale. Refer to Sect. 4.2.2 for more details. The circle at bottom left corner represents the beam size. The red colour marker “+” indicates the location of the host galaxy. In source J110613.55+485748.29 (sub-image c), the two red markers indicate the inner pair of the DDRG and the black markers indicate the outer pair of the DDRG. |
| In the text | |
|
Fig. 12. DDRGs postage-1 (7–12 DDRGs) made using LoTSS DR1 144 MHz radio image with 6″ × 6″ resolution in inverted blue colour scale. Refer to Sect. 4.2.2 for more details. |
| In the text | |
|
Fig. 13. DDRGs postage-1 (13–14 DDRGs) made using LoTSS DR1 144 MHz radio image with 6″ × 6″ resolution in inverted blue colour scale. Refer to Sect. 4.2.2 for more details. |
| In the text | |
|
Fig. 14. Distribution of M200 (mass of the cluster within r200) of clusters of galaxies. |
| In the text | |
|
Fig. A.1. LoTSS high-resolution (∼6″) images 1–30 with LoTSS low-resolution (∼20″) contours overlaid. The cross “+” marker indicates the location of the host galaxy. The radio contours are drawn with eight levels, which are chosen by equally (log scale) dividing the data value range above ∼3σ, where σ is the local rms of the map. |
| In the text | |
|
Fig. A.2. LoTSS high-resolution (∼6″) images 31–60 with LoTSS low-resolution (∼20″) contours overlaid. The cross “+” marker indicates the location of the host galaxy. The radio contours are drawn with eight levels, which are chosen by equally (log scale) dividing the data value range above ∼3σ, where σ is the local rms of the map. |
| In the text | |
|
Fig. A.3. LoTSS high-resolution (∼6″) images 61–90 with LoTSS low-resolution (∼20″) contours overlaid. The cross “+” marker indicates the location of the host galaxy. The radio contours are drawn with eight levels, which are chosen by equally (log scale) dividing the data value range above ∼3σ, where σ is the local rms of the map. |
| In the text | |
|
Fig. A.4. LoTSS high-resolution (∼6″) images 91–120 with LoTSS low-resolution (∼20″) contours overlaid. The cross “+” marker indicates the location of the host galaxy. The radio contours are drawn with eight levels, which are chosen by equally (log scale) dividing the data value range above ∼3σ, where σ is the local rms of the map. |
| In the text | |
|
Fig. A.5. LoTSS high-resolution (∼6″) images 121–150 with LoTSS low-resolution (∼20″) contours overlaid. The cross “+” marker indicates the location of the host galaxy. The radio contours are drawn with eight levels, which are chosen by equally (log scale) dividing the data value range above ∼3σ, where σ is the local rms of the map. |
| In the text | |
|
Fig. A.6. LoTSS high-resolution (∼6″) images 151–180 with LoTSS low-resolution (∼20″) contours overlaid. The cross “+” marker indicates the location of the host galaxy. The radio contours are drawn with eight levels, which are chosen by equally (log scale) dividing the data value range above ∼3σ, where σ is the local rms of the map. |
| In the text | |
|
Fig. A.7. LoTSS high-resolution (∼6″) images 181–210 with LoTSS low-resolution (∼20″) contours overlaid. The cross “+” marker indicates the location of the host galaxy. The radio contours are drawn with eight levels, which are chosen by equally (log scale) dividing the data value range above ∼3σ, where σ is the local rms of the map. |
| In the text | |
|
Fig. A.8. LoTSS high-resolution (∼6″) images 211–239 with LoTSS low-resolution (∼20″) contours overlaid. The cross “+” marker indicates the location of the host galaxy. The radio contours are drawn with eight levels, which are chosen by equally (log scale) dividing the data value range above ∼3σ, where σ is the local rms of the map. |
| In the text | |
Current usage metrics show cumulative count of Article Views (full-text article views including HTML views, PDF and ePub downloads, according to the available data) and Abstracts Views on Vision4Press platform.
Data correspond to usage on the plateform after 2015. The current usage metrics is available 48-96 hours after online publication and is updated daily on week days.
Initial download of the metrics may take a while.