Fig. 8.
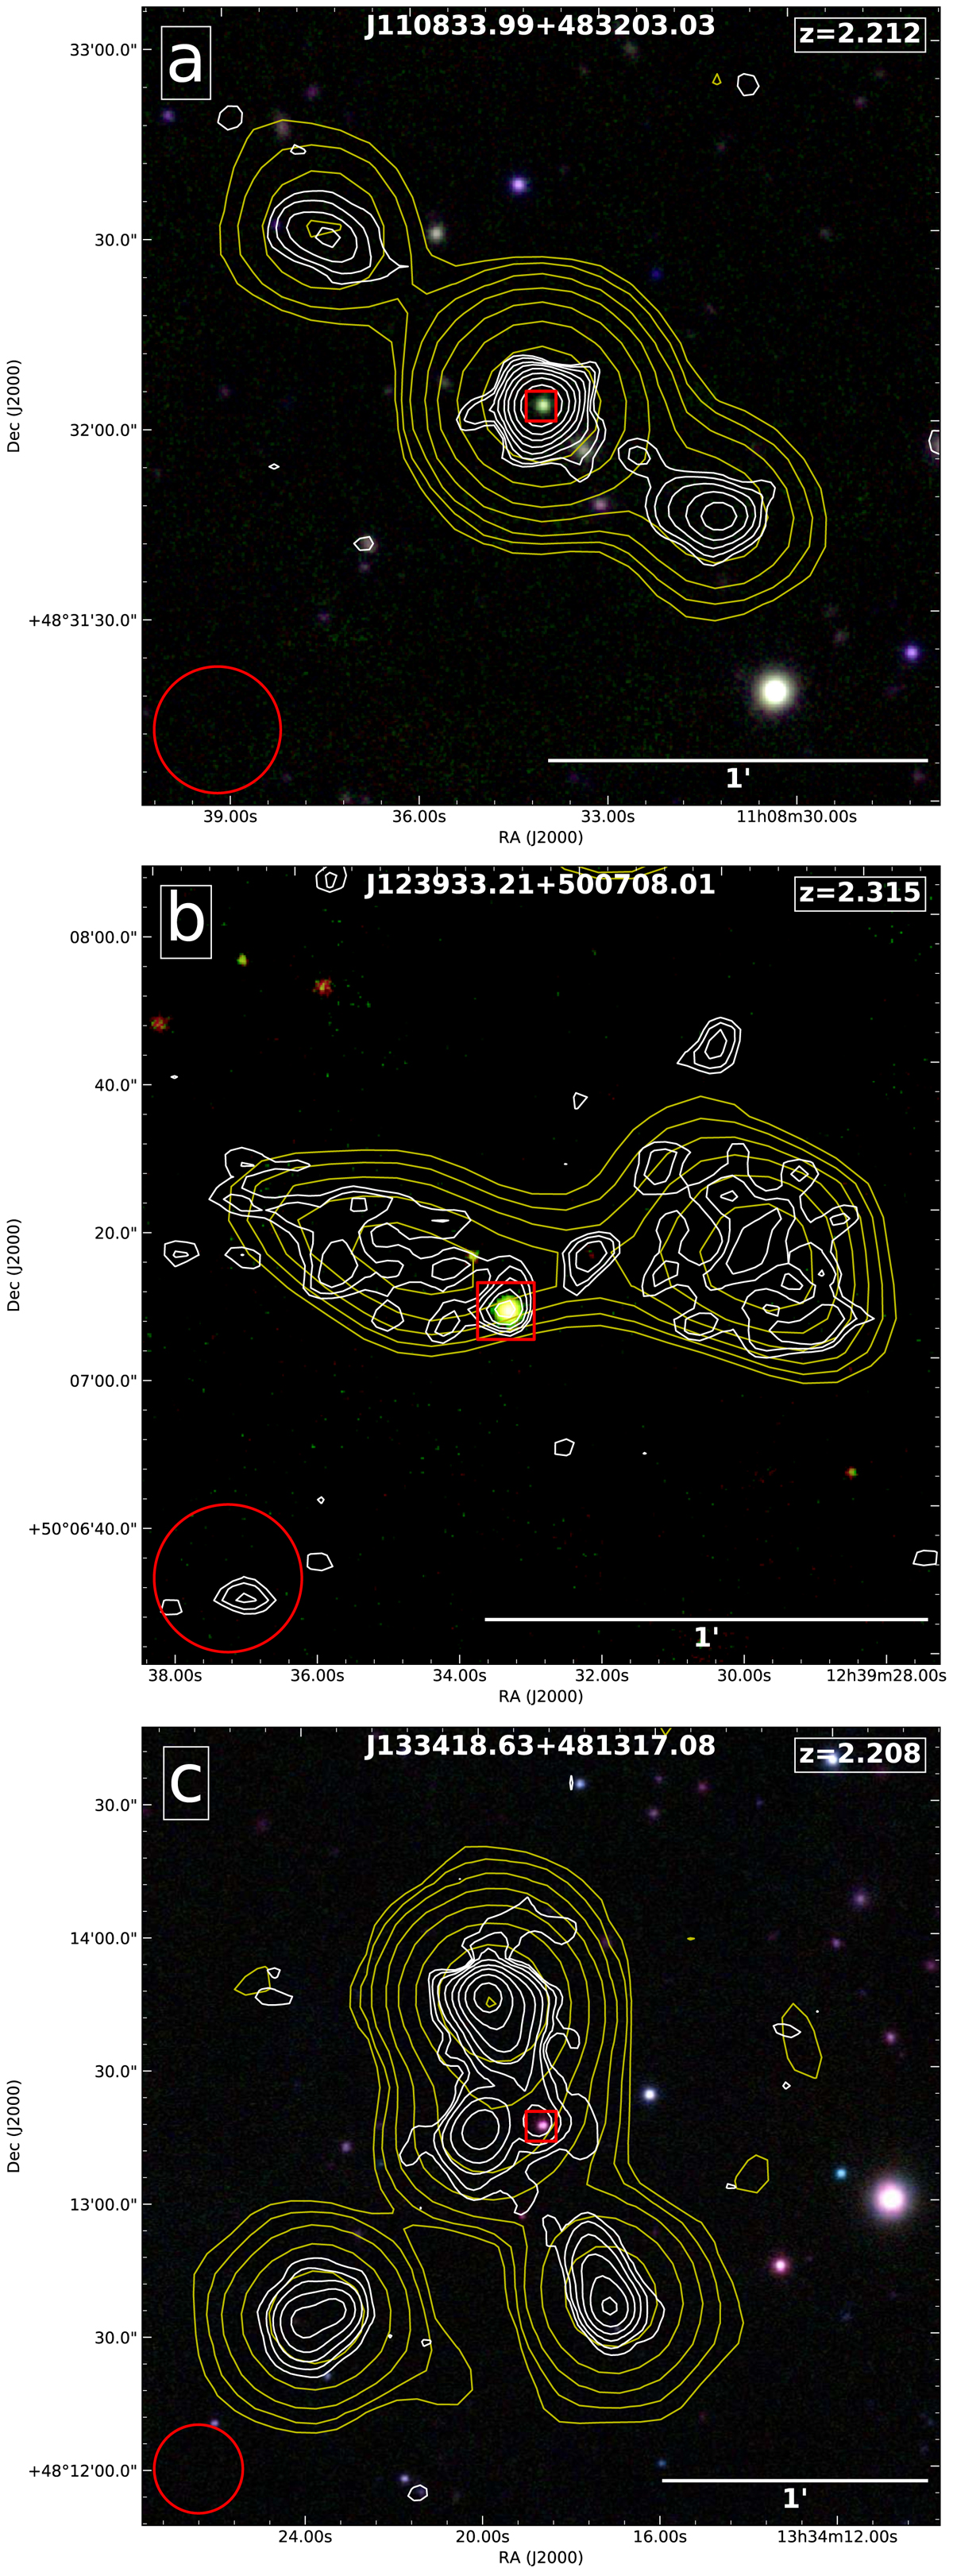
Optical-radio overlay of high redshift (z > 2) GRGs, where the optical images colour composite of three bands of PanSTARRS and radio is from the LoTSS DR-1 at two resolutions. The red square indicates the host of the three GRQs. The white and yellow colour contours represent LoTSS high (6″ × 6″) and low (20″ × 20″; red circles at bottom left) resolution maps, respectively, which have eight equally spaced relative contour levels starting from three times σ, where σ denotes the local rms noise.
Current usage metrics show cumulative count of Article Views (full-text article views including HTML views, PDF and ePub downloads, according to the available data) and Abstracts Views on Vision4Press platform.
Data correspond to usage on the plateform after 2015. The current usage metrics is available 48-96 hours after online publication and is updated daily on week days.
Initial download of the metrics may take a while.