Free Access
Fig. A.7.
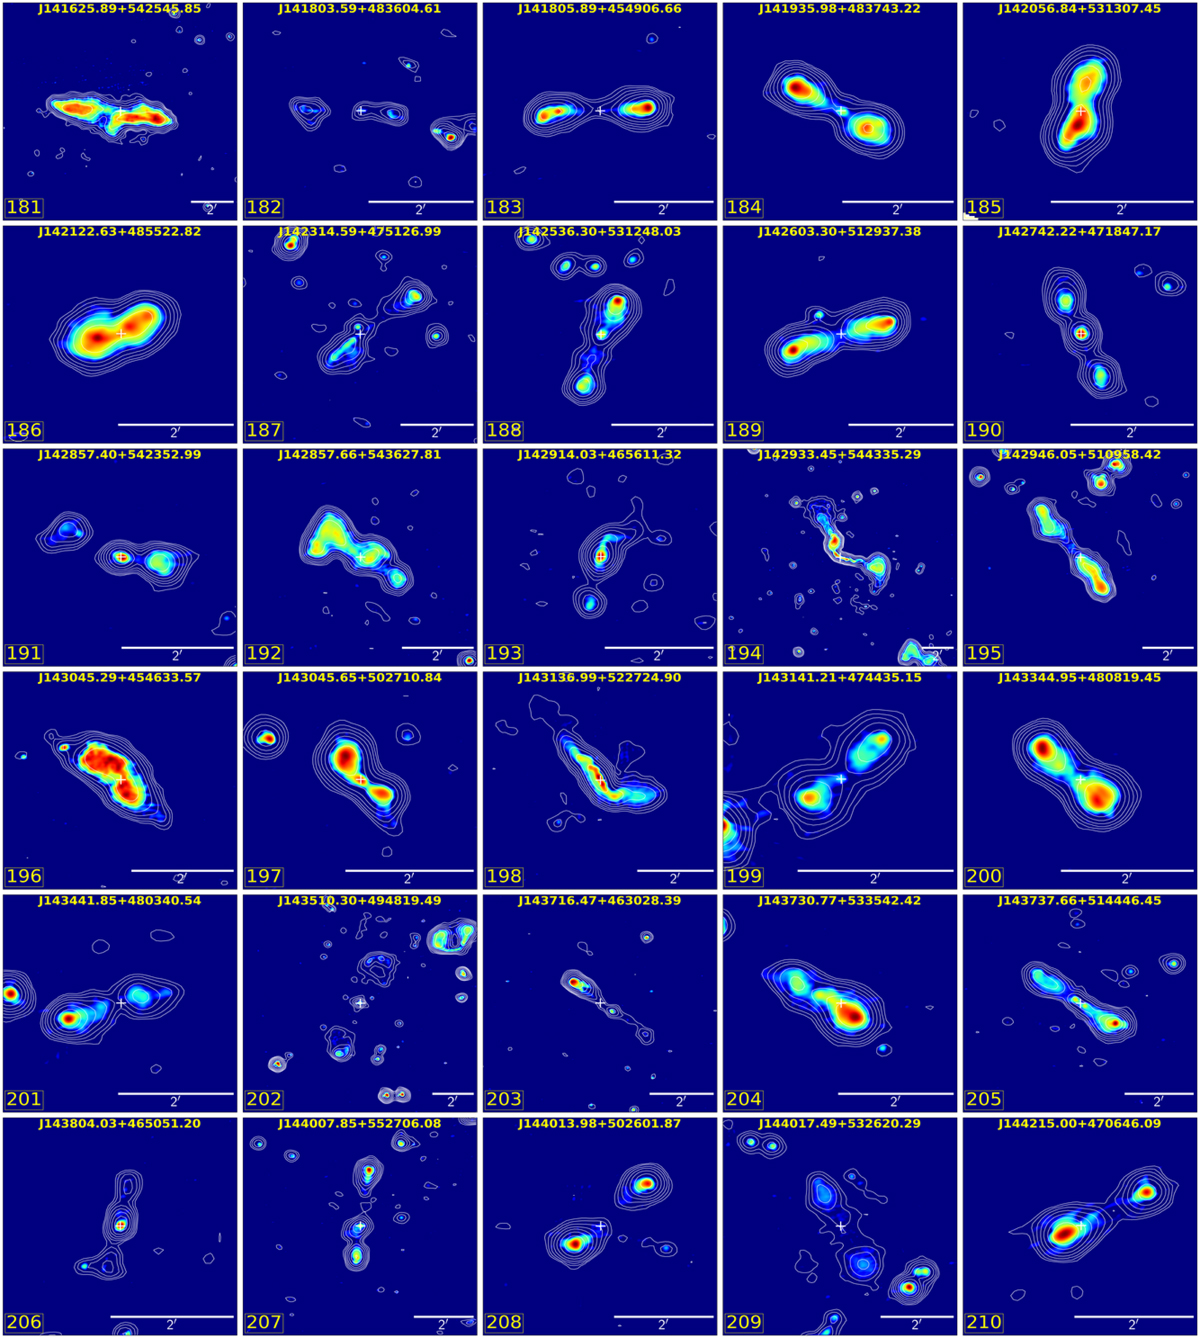
LoTSS high-resolution (∼6″) images 181–210 with LoTSS low-resolution (∼20″) contours overlaid. The cross “+” marker indicates the location of the host galaxy. The radio contours are drawn with eight levels, which are chosen by equally (log scale) dividing the data value range above ∼3σ, where σ is the local rms of the map.
Current usage metrics show cumulative count of Article Views (full-text article views including HTML views, PDF and ePub downloads, according to the available data) and Abstracts Views on Vision4Press platform.
Data correspond to usage on the plateform after 2015. The current usage metrics is available 48-96 hours after online publication and is updated daily on week days.
Initial download of the metrics may take a while.