| Issue |
A&A
Volume 634, February 2020
|
|
|---|---|---|
| Article Number | L3 | |
| Number of page(s) | 5 | |
| Section | Letters to the Editor | |
| DOI | https://doi.org/10.1051/0004-6361/201937319 | |
| Published online | 31 January 2020 | |
Letter to the Editor
First detection of the 448 GHz ortho-H2O line at high redshift: probing the structure of a starburst nucleus at z = 3.63
1
European Southern Observatory, Alonso de Córdova 3107, Casilla, 19001 Vitacura, Santiago, Chile
e-mail: cyang@eso.org
2
Universidad de Alcalá, Departamento de Física y Matemáticas, Campus Universitario, 28871 Alcalá de Henares, Madrid, Spain
3
Institut d’Astrophysique de Paris, UMR7095 CNRS & Sorbonne Université (UPMC), 98 bis bd Arago, 75014 Paris, France
4
Centro de Astrobiología (CSIC-INTA), Ctra. de Ajalvir, Km 4, 28850 Torrejón de Ardoz, Madrid, Spain
5
George Mason University, Department of Physics & Astronomy, MS 3F3, 4400 University Drive, Fairfax, VA 22030, USA
6
Institut d’Astrophysique Spatiale, CNRS UMR 8617, Université Paris-Sud, Université Paris-Saclay, 91405 Orsay, France
Received:
14
December
2019
Accepted:
17
January
2020
Submillimeter rotational lines of H2O are a powerful probe in warm gas regions of the interstellar medium (ISM), tracing scales and structures ranging from kiloparsec disks to the most compact and dust-obscured regions of galactic nuclei. The ortho-H2O(423 − 330 line at 448 GHz, which has recently been detected in a local luminous infrared galaxy, offers a unique constraint on the excitation conditions and ISM properties in deeply buried galaxy nuclei because the line requires high far-infrared optical depths to be excited. In this letter, we report the first high-redshift detection of the 448 GHz H2O(423–330) line using ALMA in a strongly lensed submillimeter galaxy (SMG) at z = 3.63. After correcting for magnification, the luminosity of the 448 GHz H2O line is ∼106 L⊙. In combination with three other previously detected H2O lines, we build a model that resolves the dusty ISM structure of the SMG, and find that it is composed of a ∼1 kpc optically thin (optical depth at 100 μm τ100 ∼ 0.3) disk component with a dust temperature Tdust ≈ 50 K that emits a total infrared power of 5 × 10¹² L⊙ with a surface density ΣIR = 4 × 10¹¹ L⊙ kpc−2, and a very compact (0.1 kpc) heavily dust-obscured (τ100 ≳ 1) nuclear core with very warm dust (100 K) and ΣIR = 8 × 10¹² L⊙ kpc−2. The H2O abundance in the core component, XH2O ∼ (0.3–5) × 10−5, is at least one order of magnitude higher than in the disk component. The optically thick core has the characteristic properties of an Eddington-limited starburst, providing evidence that radiation pressure on dust is capable of supporting the ISM in buried nuclei at high redshifts. The multicomponent ISM structure revealed by our models illustrates that dust and molecules such as H2O are present in regions that are characterized by highly differing conditions and scales, extending from the nucleus to more extended regions of SMGs.
Key words: galaxies: high-redshift / galaxies: ISM / infrared: galaxies / submillimeter: galaxies / radio lines: ISM / ISM: molecules
© ESO 2020
1. Introduction
Either in the gas phase in warm regions or locked onto dust mantles in cold environments, H2O is one of the most abundant molecules in the interstellar medium (ISM). In addition to probing a variety of physical processes such as shocks (Flower & Pineau Des Forêts 2010), radiative pumping (González-Alfonso et al. 2008), and outflowing gas (van der Tak et al. 2016), it plays an essential role in the oxygen chemistry of the ISM (e.g., van Dishoeck et al. 2013). Recent observations of the rotational transitions of the H2O lines in the submillimeter (submm) bands show their ubiquity in infrared (IR) bright galaxies and reveal the tight relation between the submm H2O lines and dust emission (Yang et al. 2013). Case studies of local IR-bright galaxies have demonstrated that far-IR pumping plays an important role in the excitation of the H2O lines (e.g., González-Alfonso et al. 2010, 2012; Liu et al. 2017). The H2O lines offer diagnostics of regions of warm gas, which are usually deeply buried in dust, probing different properties of the ISM than are probed by collisionally excited lines like CO. By modeling the H2O excitation, dust properties such as the dust temperature, far-IR optical depth, and IR luminosity can be constrained and can even be decomposed into multiple components that reveal the structure of the dust-obscured ISM (e.g., Falstad et al. 2015).
H2O lines are a particularly powerful diagnostic tool for studying dusty galaxies. At high redshifts, such galaxies were first discovered in the submm and later characterized as submm galaxies (SMGs, e.g., Smail et al. 1997, or dusty star-forming galaxies, DSFGs, Casey et al. 2014). SMGs are undergoing massive star formation, sometimes reaching the maximum starburst limit (e.g., Barger et al. 2014). The extremely intense star formation suggests that SMGs are in the critical phase of rapid stellar mass assembly. They are likely linked to the local massive spheroidal galaxies (e.g., Toft et al. 2014). However, the nature of SMGs remains debated (e.g., Davé et al. 2010; Narayanan et al. 2015), in part due to the lack of spatially resolved studies of their dusty ISM. Heretofore, most of the H2O studies at high redshifts have been based on observations with low spatial resolution, which reveal the average properties of the ISM in SMGs (e.g., Omont et al. 2013; Yang et al. 2016). Nevertheless, with ALMA, Calistro Rivera et al. (2018) have reported evidence of significant radial variation of the ISM properties in SMGs and suggested caution when interpreting single band dust continuum data. Furthermore, by measuring the structure of the dusty ISM, we can assess the stellar mass assembly history of SMGs and build a link to current galaxy populations (e.g., Lang et al. 2019). However, observations like this require resolving the continuum emission in multiple bands that sample the peak of the dust spectral energy distribution (SED) at high frequencies. Moreover, accessing the most dust-obscured regions is observationally challenging. The H2O lines thus provide an alternative approach to constrain the structure and properties of the dusty ISM in SMGs, owing to their tight link to the far-IR radiation field.
The ortho-H2O(423 − 330) line (Eu = 433 K) at 448.001 GHz has recently been detected for the first time in space, with the Atacama Large Millimeter/submillimeter Array (ALMA) in ESO 320-G030, an isolated IR-luminous barred spiral that is likely powered by a starburst because based on X-ray and mid-IR diagnostics, there is no evidence for an obscured active galactic nucleus (AGN; Pereira-Santaella et al. 2017). In this source, H2O(423 − 330) is excited by intense far-IR radiation, rather than being a maser line, as predicted by collisional models (e.g., Neufeld & Melnick 1991; Gray et al. 2016). The spatially resolved observations of the H2O(423 − 330) line and dust continuum in ESO 320-G030 indicate that the line arises from a highly obscured galactic nucleus. Therefore, this highly excited H2O line is an ideal probe of the deeply buried (optically thick in the far-IR), warm dense nuclear ISM of galaxies.
In this Letter, we report the first high-redshift detection of the ortho-H2O(423 − 330) line in a strongly lensed SMG at z = 3.63 in the SMG merging pair G09v1.97. It was first discovered with Herschel (Bussmann et al. 2013) and was followed up with observation of low spatial resolution of several H2O and CO lines (Yang et al. 2016, 2017) and a high-resolution observation of the H2O(211 − 202) and CO(6 − 5) lines (Yang et al. 2019, Y19 hereafter). G09v1.97 has a total molecular gas mass of 1011 M⊙, and is composed of two gas-rich merging galaxies. The two galaxies, dubbed G09v1.97-R (the receding northern galaxy) and G09v1.97-B (the approaching southern galaxy), are separated by a projected distance of 1.3 kpc (∼0 2) and have total intrinsic IR luminosities (8–1000 μm) of 6.3 × 10¹² and 4.0 × 10¹² L⊙, respectively. While both G09v1.97-R and G09v1.97-B are one order of magnitude more powerful than ESO 320-G030 in IR luminosity, like ESO 320-G030, these galaxies are likely powered by star formation, based on their similar line-to-IR luminosity ratios of LCO(6 − 5)/LIR and LH2O(211 − 202) /LIR (Yang et al. 2013, Y19).
We adopt a spatially flat ΛCDM cosmology with H0 = 67.8 km s−1 Mpc−1, ΩM = 0.308 (Planck Collaboration III 2016), and a Chabrier (2003) initial mass function (IMF) throughout this work.
2. Observations and data reduction
The ALMA observations presented here are part of a dense gas line survey project (ADS/JAO.ALMA#2018.1.00797.S, Yang et al., in prep.). The observations were carried out between December 2018 and January 2019. In this work, we only present data from the Band-3 spectral window covering the ortho-H2O(423 − 330) line centered at 96.137 GHz (observed frequency). Forty-three antennas of the 12 m array were used. The observations were performed under good weather conditions (PWV = 2–5 mm, phase RMS < 9°) with the C43-2 configuration, which provides baselines ranging from 15 to 200 m. J0825+0309 was used as the phase calibrator and J0750+1231 as the bandpass and flux calibrator. A typical ALMA Band-3 calibration uncertainty of 5% is adopted. The total on-source time was 118.4 min, with an additional overhead time of 47.7 min, resulting in a sensitivity of ∼0.12 mJy beam−1 in 50 km s−1 velocity bins.
The data were calibrated using the ALMA calibration pipelines with minor flagging. The calibrated data were further processed with imaging and CLEANing using the tclean procedure of the CASA software (McMullin et al. 2007) version 5.4.0, with a natural weighting (synthesis beam size of 2.46″ × 2.03″ and PA = 78.2°) to maximize the signal-to-noise ratio. The beam size is unable to resolve the source, which has a largest angular structure of ∼2″(Y19). The spectrum was then extracted from the spatially integrated emission over the entire source (Fig. 1).
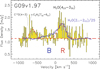 |
Fig. 1. Spatially integrated spectrum of the 448 GHz H2O line of G09v1.97 (yellow histograms). B and R correspond to the blue- and redshifted components of G09v1.97. The overlaid blue line shows the observed H2O(211 − 202) line (Y19) after scaling its flux density down by a factor of 25. The dashed red lines show Gaussian fitting to the emission lines. Close to the 448 GHz H2O line, we also tentatively detect a 2.3σ emission line (at the velocity of the R component) at ∼449 GHz, which may be either C17O(4–3) or c-C3H2(762 − 651). If the emission is indeed C17O(4–3), the integrated flux density ratio of C16O(4–3)/C17O(4–3) would be ∼110, which will be discussed in Yang et al. (in prep.). The dust continuum at rest frame 615 μm is also detected with a flux density of 1.13 ± 0.04 mJy. |
3. Analysis and discussion
As shown by the high-angular resolution observations in Y19, the CO(6–5) and H2O(211 − 202) lines of G09v1.97 both mainly consist of B and R components (which are blueshifted and redshifted, respectively, compared to the system velocity of G09v1.97), with line widths of ∼300 km s−1 (Fig. 1). The B component originates exclusively from the approaching galaxy G09v1.97-B, while the R component arises from the receding galaxy G97v1.97-R. Therefore, the contribution to the spectrum from each merger companion can be distinguished without spatially resolved observations. The lensing magnification for the line varies from ∼5 to ∼22 as a function of velocity from the blueshifted to the redshifted velocity components, due to a velocity gradient from south to north (Y19). As a result, R is a factor of ≳4 brighter than B in the spectrum, causing an extremely asymmetric line profile (blue histogram in Fig. 1). The 448 GHz H2O line is detected with ≳5σ significance, but only in the redshifted component (Fig. 1), namely only in G09v1.97-R. Assuming a similar flux ratio of H2O(423 − 330)/H2O(211 − 202) in R and B, the 448 GHz H2O line in G09v1.97-B is thus buried below the noise level. Therefore, we associate the detected 448 GHz H2O line only with G09v1.97-R. We therefore corrected the lensing magnification for the H2O line fluxes of G09v1.97-R, as listed in Table 1. The table also includes the observational results on the H2O(321 − 312) (Yang et al. 2016) and H2O(422 − 413) lines (Yang 2017) for G09v1.97-R, which were obtained with NOEMA with a similar spatial resolution of ≳2″(unresolved). The continuum measurements, which are used below to model the H2O emission, were also corrected to account for G09v1.97-R alone. The limited spatial resolution of the currently highest spatial resolution dust continuum images (Y19) does not allow us to distinguish the fluxes from the merger companions. Nevertheless, the relative contribution by G09v1.97-R can be approximated using the tight correlation between LCO(6 − 5) and LIR (Liu et al. 2015; Yang et al. 2017). Because the intrinsic line fluxes from R are about 50% of the total and the magnifications R and B are μR ≈ 20 and μB ≈ 5, respectively (Y19), the intrinsic continuum flux densities from G09v1.97-R are a factor ≈25 lower than the observed values integrated over the entire G09v1.97 system. We here therefore scaled the measured continuum fluxes down by a factor of 25 and include an uncertainty of 20% associated with the flux scaling.
Spatially integrated H2O line properties of G09v1.97-R.
In G09v1.97-R, the 448 GHz ortho-H2O(423 − 330) line has a luminosity of 8.5 × 10⁵ L⊙, which is a fraction of 10−7 of the total IR luminosity. In addition to the 448 GHz H2O line, three additional lines of H2O have previously been detected in G09v1.97-R (Fig. 2 and Table 1): the ortho-H2O(321 − 312), the para-H2O(211 − 202), and the para-H2O(422 − 413) transitions. Interestingly, the 423 − 330 and 422 − 413 transitions have Jupper = 4 levels with very similar energies (425 K versus 433 K), but their A-Einstein coefficients for spontaneous emission differ by a factor of ≈500 : 5.4 × 10⁻⁵ and 2.8 × 10⁻² s−1, respectively (Pickett et al. 1998). Assuming that the upper-level populations of both lines do not strongly differ from the ortho-to-para ratio of 3 appropriate for warm regions, their flux ratio (in Jy km s−1) in optically thin conditions should be F(1208 GHz)/F(448 GHz)∼Aul(1208 GHz)/(3Aul(448 GHz)) ∼ 170. The observed flux ratio in G09v1.97-R is only ≈11 (Table 1), similar to the value of ≈15 found in ESO 320-G030 (González-Alfonso et al., in prep.), indicating that the ortho-H2O(422 − 413) line is strongly saturated in both sources. Similar to the situation found in buried nuclei of local (ultra)-luminous IR galaxies ((U)LIRGs), high radiation and column densities in a nuclear component are required to pump the Jupper = 4 levels and to account for the corresponding strong H2O emission from G09v1.97-R.
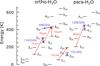 |
Fig. 2. Energy level diagram of the main para- and ortho-H2O transitions. Blue arrows indicate the emission lines modeled in this work. Red arrows show the transitions responsible for the associated radiative pumping. The frequencies of the lines and the wavelengths of the far-IR photons are labeled. |
To estimate the physical conditions and structure of the ISM in G09v1.97-R from the observed H2O and dust continuum emission, a library of model components was developed following the method described in González-Alfonso et al. (2014). We assumed for each component a spherically symmetric source with uniform physical properties: the dust temperature Tdust, the continuum optical depth at 100 μm along a radial path τ100, the column density of H2O along a radial path NH2O, the H2 density nH2, the velocity dispersion ΔV, and the gas temperature Tgas. The physical parameters modified from model to model are Tdust, τ100, NH2O, and nH2, and we kept ΔV = 100 km s−1 and Tgas = 150 K fixed (consistent with the results from CO excitation, Yang et al. 2017). The model components were classified into groups according to their physical parameters, each group covering a regular grid in the parameter space (Tdust, τ100, NH2O, and nH2). After we created the model components, all available H2O line fluxes and continuum flux densities were fit simultaneously using a number NC of model components (up to two components per group) and checking all possible combinations among them. Because the intrinsic line and continuum fluxes (in Jy km s−1 and Jy, respectively) scale as (1 + z) (R/DL)2, where R is the source radius and DL = 32.7 Gpc is the luminosity distance, a χ2 minimization procedure was used to determine the source radius R of each component for all combinations of model components. Our best model fit corresponds to the combination that yields the lowest χ2, while the results for all combinations enable us to calculate the likelihood distribution of the free physical parameters (e.g., Ward et al. 2003), i.e., Tdust, τ100, NH2O, and nH2, for each component. The derived parameters (R, the H2O abundance relative to H nuclei XH2O, and LIR) can also be inferred. More details will be given in González-Alfonso et al. (in prep.).
We first attempted to fit the H2O and continuum emission with a single-model component (NC = 1), but results were unreliable, with a best reduced chi-square value  . This was indeed expected because the low-lying H2O Jupper = 2–3 lines are expected to arise in more extended regions than the Jupper = 4 lines that trace buried regions (e.g., González-Alfonso et al. 2014; Pereira-Santaella et al. 2017). A better fit was found with NC = 2 components (Fig. 3), with
  . In Fig. 4, the arrows indicate the best-fit values, and solid histograms show their likelihood distributions. We find that the Jupper = 4 lines are formed in a very warm nuclear region (core) with size R ∼ 100 pc and Tdust ∼ 100 K, which is most probably optically thick at far-IR wavelengths (τ100 ≳ 1). This nuclear core has a luminosity of LIR ∼ 1012 L⊙, resulting in an extreme IR luminosity surface density ΣIR = 8 × 10¹² L⊙ kpc−2. This translates into a surface star formation rate of ∼1.1 × 10³ M⊙ yr−1 kpc−2 if the contribution to LIR by a possible obscured AGN is negligible because no strong evidence of the presence of an AGN has been found (Yang et al. 2016). A high column density of water, NH2O ∼ 1019 cm−2 (XH2O ∼ 10−5), is found in this core component, which is more than one order of magnitude higher than in the z = 3.9 quasar host galaxy APM 08279+5255 (van der Werf et al. 2011). In addition, the Jupper = 2–3 lines, pumped by absorption of dust-emitted 100 and 75 μm photons (Fig. 2), require an optically thin (τ100 ∼ 0.3) and more extended region of radius ∼1 kpc (the disk component), remarkably similar to the projected half-light effective radius traced by the CO(6 − 5) and H2O(211 − 202) line emission (0.8 kpc, Y19), and also to the size of the averaged 870 μm dust continuum of SMGs (∼1 kpc, Gullberg et al. 2019). With Tdust ∼ 50 K, the disk component dominates the luminosity with LIR ∼ 5 × 10¹² L⊙ and ΣIR = 4 × 10¹¹ L⊙ kpc−2 (corresponding to ∼60 M⊙ yr−1 kpc−2), and has a lower column density and abundance of water than the core, with NH2O ∼ 1016 cm−2 (XH2O ∼ 10−7).
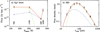 |
Fig. 3. Best-fit two-component model of G09v1.97-R for (a) the H2O lines and (b) the dust continuum (colored symbols and lines) compared with observations (black symbols with error bars). Predictions for the two individual ISM components are displayed with dashed green (the disk component) and blue lines (the core component); the total is shown in red. The physical parameters adopted from this model are indicated with arrows in Fig. 4. Panel a: numbers indicate the rest frequencies of the lines in GHz. The observed H2O fluxes and continuum flux densities have been corrected for magnification. The continuum fluxes have also been corrected to only account for the contribution by G09v1.97-R, as described in Sect. 2 (see also Y19). |
While the effect of the cosmic microwave background (CMB) on the dust SED is included in Fig. 3b following da Cunha et al. (2013) (see also Zhang et al. 2016), the correction is small as Tdust ≫ TCMB = 12.5 K. The excitation of H2O by the CMB, however, is not included in our models, but we verified that for our best-fit model (Fig. 3a), it has a negligible effect on the excitation and flux of the observed lines. A more important source of uncertainty is that our models do not include the effects of spatially varying Tdust that are expected in regions that are optically thick in the far-IR (González-Alfonso & Sakamoto 2019). An increasing Tdust outside-in would facilitate the H2O excitation within the core component, and would thus decrease the inferred NH2O to some extent. This effect becomes most relevant for extremely buried sources with NH2 approaching 1025 cm−2 (τ100 ≳ 10), which is not excluded for the nuclear core of G09v1.97-R (Fig. 4b).
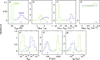 |
Fig. 4. Solid histograms indicate the likelihood distributions for the physical parameters of the two-component model (green and blue for the disk and core component, respectively). (a)–(d) are fitted parameters while (e)–(f) are derived parameters. Dotted histograms show the likelihood distributions of a fit that ignores the 448 GHz H2O line, showing consistent results but a high uncertainty in NH2O and XH2O. The arrows indicate the values of the best model fit, with results for the H2O fluxes and continuum flux densities displayed in Fig. 3. |
What is the role of the 448 GHz H2O line in constraining the model? The dotted histograms in Fig. 4 show that if the 448 GHz H2O line is excluded, the likelihood distributions of the physical parameters remain similar, but show a less informative distribution for NH2O (and XH2O). In this case, the parameters of the nucleus are determined by the 1208 GHz H2O line, which is optically thick (τ1208 − H2O = 27.5). The detection of the more optically thin 448 GHz H2O line (τ448 − H2O = 1.0) confirms the occurrence of the warm nuclear region and enables a significantly more accurate estimate of its NH2O (and XH2O). On the other hand, the flat distributions of nH2 in both regions indicate that the excitation of these H2O lines is insensitive to nH2.
Our models, which fit the H2O line and dust continuum fluxes simultaneously, are sensitive to NH2O and τ100. These two parameters, treated as independent, are linked as XH2O = NH2O/(1.3 × 1024τ100(GDR/100)), where GDR is the gas-to-dust ratio by mass. For the core component, our best fit yields NH2O/τ100 ∼ 5 × 1018 cm−2. With the assumption of a GDR = 100, we obtain XH2O ∼ (0.3–5) × 10−5 (90% confidence interval, Fig. 4e), similar to the abundance in buried galactic nuclei of local (U)LIRGs (González-Alfonso et al. 2012). The similarity of the NH2O/τ100 ratio in the nuclear cores of SMGs and of local (U)LIRGs appears to indicate a fundamental similarity of the gas metallicity to dust ratio in buried galactic nuclei throughout cosmic times.
With the H2O excitation models, we are able to resolve two distinct components with significantly different properties (e.g., Tdust and τ100). These differences reveal the complexity of the ISM structure in SMGs and suggest caution when deriving the physical properties from spatially unresolved observations. For example, an increase in dust temperature and optical depth toward the nuclear region can significantly alter the calculation of size and mass of the ISM dust (e.g., Miettinen et al. 2017; Calistro Rivera et al. 2018). While the value of the star formation rate surface density of the disk component, which dominates the total IR emission, is typical of SMGs (Hodge et al. 2013), the nuclear core shows more extreme conditions. The properties of the optically thick core show excellent agreement with the characteristic LIR surface density (∼1013 L⊙ kpc−2) and dust temperature (∼90 K) of Eddington-limited starburst models (Thompson et al. 2005), indicating the importance of radiation pressure on dust in regulating the ISM in the inner 100 pc region of G09v1.97-R. Although we cannot rule out a contribution to the far-IR from an obscured AGN, in addition to the arguments disfavoring a dominant AGN power source discussed in the introduction and in Y19, we also find no strong evidence for the presence of a powerful AGN in G09v1.97-R by checking the q parameter (Condon 1992) and mid-IR excess (see discussions in Yang et al. 2016). This strengthens the case for Eddington-limited starbursts. Nevertheless, further observations are needed to quantify the contribution from an AGN.
4. Conclusions
We reported the first detection of the 448 GHz ortho-H2O(423 − 330) line at high redshift in the z = 3.63 lensed submillimeter galaxy G09v1.97-R. In combination with three other transitions of H2O and dust emission, we have built a radiative transfer model for the H2O excitation and dust emission. The model decomposes the dust continuum of the SMG into two components, a ∼1 kpc optically thin (τ100 ∼ 0.3) disk component with Tdust = 50 K emitting a total IR luminosity of ∼5 × 10¹² L⊙, and a ∼0.1 kpc heavily dust-obscured (τ100 ≳ 1) nuclear core with very warm dust (100 K) and an IR luminosity of ∼1012 L⊙. The water abundance in the core (XH2O ∼ 5 × 10⁻⁶) is more than one order of magnitude higher than in the more extended disk. The surface star formation rate of the core component is ΣSFR = 1.1 × 10³ M⊙ yr−1 kpc−2, which is ∼20 times higher than that of the disk. The ISM properties of the nucleus of G09v1.97-R resemble the characteristic conditions of an Eddington-limited starburst, indicating that radiation pressure on dust plays an essential role in supporting the ISM.
The optically thin 448 GHz H2O line is a powerful tool for the study of SMGs around redshift 2–4 (with ALMA Bands 3 and 4). The multicomponent structure derived from the H2O excitation model reveals the complex nature and morphology of SMGs and may offer clues about the evolutionary link of the SMGs to massive elliptical galaxies today, once high-resolution near-infrared observations of the stellar component are possible and become available with telescopes such as the James Webb Space Telescope, JWST.
Acknowledgments
We thank the anonymous referee for very helpful suggestions. C.Y. acknowledges support from an ESO Fellowship. E.G.-A. is a Research Associate at the Harvard-Smithsonian Center for Astrophysics, and thanks the Spanish Ministerio de Economía y Competitividad for support under project ESP2017-86582-C4-1-R. E.G.-A. also thanks the support from the ESO Chile Scientific Visitor Programme. M.P.S. acknowledges support from the Comunidad de Madrid through Atracción de Talento Investigador Grant 2018-T1/TIC-11035. This paper makes use of the following ALMA data: ADS/JAO.ALMA#2018.1.00797.S. ALMA is a partnership of ESO (representing its member states), NSF (USA) and NINS (Japan), together with NRC (Canada), MOST and ASIAA (Taiwan), and KASI (Republic of Korea), in cooperation with the Republic of Chile. The Joint ALMA Observatory is operated by ESO, AUI/NRAO and NAOJ.
References
- Barger, A. J., Cowie, L. L., Chen, C.-C., et al. 2014, ApJ, 784, 9 [NASA ADS] [CrossRef] [Google Scholar]
- Bussmann, R. S., Pérez-Fournon, I., Amber, S., et al. 2013, ApJ, 779, 25 [NASA ADS] [CrossRef] [Google Scholar]
- Calistro Rivera, G., Hodge, J. A., Smail, I., et al. 2018, ApJ, 863, 56 [NASA ADS] [CrossRef] [Google Scholar]
- Casey, C. M., Narayanan, D., & Cooray, A. 2014, Phys. Rep., 541, 45 [NASA ADS] [CrossRef] [Google Scholar]
- Chabrier, G. 2003, PASP, 115, 763 [NASA ADS] [CrossRef] [Google Scholar]
- Condon, J. J. 1992, ARA&A, 30, 575 [NASA ADS] [CrossRef] [MathSciNet] [Google Scholar]
- da Cunha, E., Groves, B., Walter, F., et al. 2013, ApJ, 766, 13 [Google Scholar]
- Davé, R., Finlator, K., Oppenheimer, B. D., et al. 2010, MNRAS, 404, 1355 [NASA ADS] [Google Scholar]
- Falstad, N., González-Alfonso, E., Aalto, S., et al. 2015, A&A, 580, A52 [NASA ADS] [CrossRef] [EDP Sciences] [Google Scholar]
- Flower, D. R., & Pineau Des Forêts, G. 2010, MNRAS, 406, 1745 [NASA ADS] [Google Scholar]
- González-Alfonso, E., & Sakamoto, K. 2019, ApJ, 882, 153 [NASA ADS] [CrossRef] [Google Scholar]
- González-Alfonso, E., Smith, H. A., Ashby, M. L. N., et al. 2008, ApJ, 675, 303 [NASA ADS] [CrossRef] [Google Scholar]
- González-Alfonso, E., Fischer, J., Isaak, K., et al. 2010, A&A, 518, L43 [NASA ADS] [CrossRef] [EDP Sciences] [Google Scholar]
- González-Alfonso, E., Fischer, J., Graciá-Carpio, J., et al. 2012, A&A, 541, A4 [NASA ADS] [CrossRef] [EDP Sciences] [Google Scholar]
- González-Alfonso, E., Fischer, J., Aalto, S., & Falstad, N. 2014, A&A, 567, A91 [NASA ADS] [CrossRef] [EDP Sciences] [Google Scholar]
- Gray, M. D., Baudry, A., Richards, A. M. S., et al. 2016, MNRAS, 456, 374 [NASA ADS] [CrossRef] [Google Scholar]
- Gullberg, B., Smail, I., Swinbank, A. M., et al. 2019, MNRAS, 490, 4956 [NASA ADS] [CrossRef] [Google Scholar]
- Hodge, J. A., Karim, A., Smail, I., et al. 2013, ApJ, 768, 91 [NASA ADS] [CrossRef] [Google Scholar]
- Lang, P., Schinnerer, E., Smail, I., et al. 2019, ApJ, 879, 54 [NASA ADS] [CrossRef] [Google Scholar]
- Liu, D., Gao, Y., Isaak, K., et al. 2015, ApJ, 810, L14 [NASA ADS] [CrossRef] [Google Scholar]
- Liu, L., Weiß, A., Perez-Beaupuits, J. P., et al. 2017, ApJ, 846, 5 [NASA ADS] [CrossRef] [Google Scholar]
- McMullin, J. P., Waters, B., Schiebel, D., Young, W., & Golap, K. 2007, in Astronomical Data Analysis Software and Systems XVI, eds. R. A. Shaw, F. Hill, & D. J. Bell, ASP Conf. Ser., 376, 127 [Google Scholar]
- Miettinen, O., Novak, M., Smolčić, V., et al. 2017, A&A, 602, A54 [NASA ADS] [CrossRef] [EDP Sciences] [Google Scholar]
- Narayanan, D., Turk, M., Feldmann, R., et al. 2015, Nature, 525, 496 [NASA ADS] [CrossRef] [PubMed] [Google Scholar]
- Neufeld, D. A., & Melnick, G. J. 1991, ApJ, 368, 215 [NASA ADS] [CrossRef] [Google Scholar]
- Omont, A., Yang, C., Cox, P., et al. 2013, A&A, 551, A115 [NASA ADS] [CrossRef] [EDP Sciences] [Google Scholar]
- Pereira-Santaella, M., González-Alfonso, E., Usero, A., et al. 2017, A&A, 601, L3 [NASA ADS] [CrossRef] [EDP Sciences] [Google Scholar]
- Pickett, H. M., Poynter, R. L., Cohen, E. A., et al. 1998, J. Quant. Spectr. Rad. Transf., 60, 883 [NASA ADS] [CrossRef] [Google Scholar]
- Planck Collaboration III. 2016, A&A, 594, A13 [NASA ADS] [CrossRef] [EDP Sciences] [Google Scholar]
- Smail, I., Ivison, R. J., & Blain, A. W. 1997, ApJ, 490, L5 [NASA ADS] [CrossRef] [Google Scholar]
- Thompson, T. A., Quataert, E., & Murray, N. 2005, ApJ, 630, 167 [NASA ADS] [CrossRef] [Google Scholar]
- Toft, S., Smolčić, V., Magnelli, B., et al. 2014, ApJ, 782, 68 [NASA ADS] [CrossRef] [Google Scholar]
- van der Tak, F. F. S., Weiß, A., Liu, L., & Güsten, R. 2016, A&A, 593, A43 [NASA ADS] [CrossRef] [EDP Sciences] [Google Scholar]
- van der Werf, P. P., Berciano Alba, A., Spaans, M., et al. 2011, ApJ, 741, L38 [NASA ADS] [CrossRef] [Google Scholar]
- van Dishoeck, E. F., Herbst, E., & Neufeld, D. A. 2013, Chemical Reviews, 113, 9043 [Google Scholar]
- Ward, J. S., Zmuidzinas, J., Harris, A. I., & Isaak, K. G. 2003, ApJ, 587, 171 [NASA ADS] [CrossRef] [Google Scholar]
- Yang, C. 2017, Ph.D. Thesis, Paris-Sud, Université Paris-Saclay, France [Google Scholar]
- Yang, C., Gao, Y., Omont, A., et al. 2013, ApJ, 771, L24 [NASA ADS] [CrossRef] [Google Scholar]
- Yang, C., Omont, A., Beelen, A., et al. 2016, A&A, 595, A80 [NASA ADS] [CrossRef] [EDP Sciences] [Google Scholar]
- Yang, C., Omont, A., Beelen, A., et al. 2017, A&A, 608, A144 [NASA ADS] [CrossRef] [EDP Sciences] [Google Scholar]
- Yang, C., Gavazzi, R., Beelen, A., et al. 2019, A&A, 624, A138 [NASA ADS] [CrossRef] [EDP Sciences] [Google Scholar]
- Zhang, Z.-Y., Papadopoulos, P. P., Ivison, R. J., et al. 2016, R. Soc. Open Sci., 3, 160025 [Google Scholar]
All Tables
All Figures
|
Fig. 1. Spatially integrated spectrum of the 448 GHz H2O line of G09v1.97 (yellow histograms). B and R correspond to the blue- and redshifted components of G09v1.97. The overlaid blue line shows the observed H2O(211 − 202) line (Y19) after scaling its flux density down by a factor of 25. The dashed red lines show Gaussian fitting to the emission lines. Close to the 448 GHz H2O line, we also tentatively detect a 2.3σ emission line (at the velocity of the R component) at ∼449 GHz, which may be either C17O(4–3) or c-C3H2(762 − 651). If the emission is indeed C17O(4–3), the integrated flux density ratio of C16O(4–3)/C17O(4–3) would be ∼110, which will be discussed in Yang et al. (in prep.). The dust continuum at rest frame 615 μm is also detected with a flux density of 1.13 ± 0.04 mJy. |
| In the text | |
|
Fig. 2. Energy level diagram of the main para- and ortho-H2O transitions. Blue arrows indicate the emission lines modeled in this work. Red arrows show the transitions responsible for the associated radiative pumping. The frequencies of the lines and the wavelengths of the far-IR photons are labeled. |
| In the text | |
|
Fig. 3. Best-fit two-component model of G09v1.97-R for (a) the H2O lines and (b) the dust continuum (colored symbols and lines) compared with observations (black symbols with error bars). Predictions for the two individual ISM components are displayed with dashed green (the disk component) and blue lines (the core component); the total is shown in red. The physical parameters adopted from this model are indicated with arrows in Fig. 4. Panel a: numbers indicate the rest frequencies of the lines in GHz. The observed H2O fluxes and continuum flux densities have been corrected for magnification. The continuum fluxes have also been corrected to only account for the contribution by G09v1.97-R, as described in Sect. 2 (see also Y19). |
| In the text | |
|
Fig. 4. Solid histograms indicate the likelihood distributions for the physical parameters of the two-component model (green and blue for the disk and core component, respectively). (a)–(d) are fitted parameters while (e)–(f) are derived parameters. Dotted histograms show the likelihood distributions of a fit that ignores the 448 GHz H2O line, showing consistent results but a high uncertainty in NH2O and XH2O. The arrows indicate the values of the best model fit, with results for the H2O fluxes and continuum flux densities displayed in Fig. 3. |
| In the text | |
Current usage metrics show cumulative count of Article Views (full-text article views including HTML views, PDF and ePub downloads, according to the available data) and Abstracts Views on Vision4Press platform.
Data correspond to usage on the plateform after 2015. The current usage metrics is available 48-96 hours after online publication and is updated daily on week days.
Initial download of the metrics may take a while.