Fig. 1.
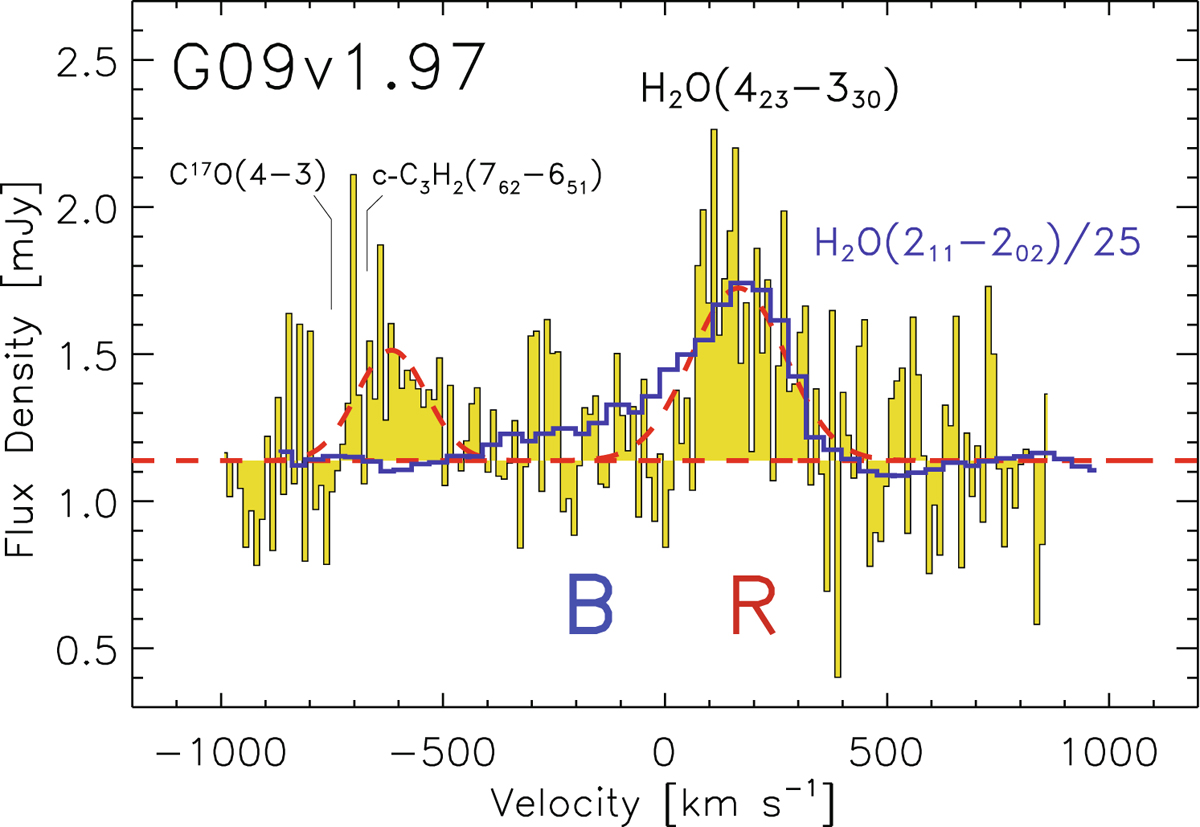
Spatially integrated spectrum of the 448 GHz H2O line of G09v1.97 (yellow histograms). B and R correspond to the blue- and redshifted components of G09v1.97. The overlaid blue line shows the observed H2O(211 − 202) line (Y19) after scaling its flux density down by a factor of 25. The dashed red lines show Gaussian fitting to the emission lines. Close to the 448 GHz H2O line, we also tentatively detect a 2.3σ emission line (at the velocity of the R component) at ∼449 GHz, which may be either C17O(4–3) or c-C3H2(762 − 651). If the emission is indeed C17O(4–3), the integrated flux density ratio of C16O(4–3)/C17O(4–3) would be ∼110, which will be discussed in Yang et al. (in prep.). The dust continuum at rest frame 615 μm is also detected with a flux density of 1.13 ± 0.04 mJy.
Current usage metrics show cumulative count of Article Views (full-text article views including HTML views, PDF and ePub downloads, according to the available data) and Abstracts Views on Vision4Press platform.
Data correspond to usage on the plateform after 2015. The current usage metrics is available 48-96 hours after online publication and is updated daily on week days.
Initial download of the metrics may take a while.