Fig. 8.
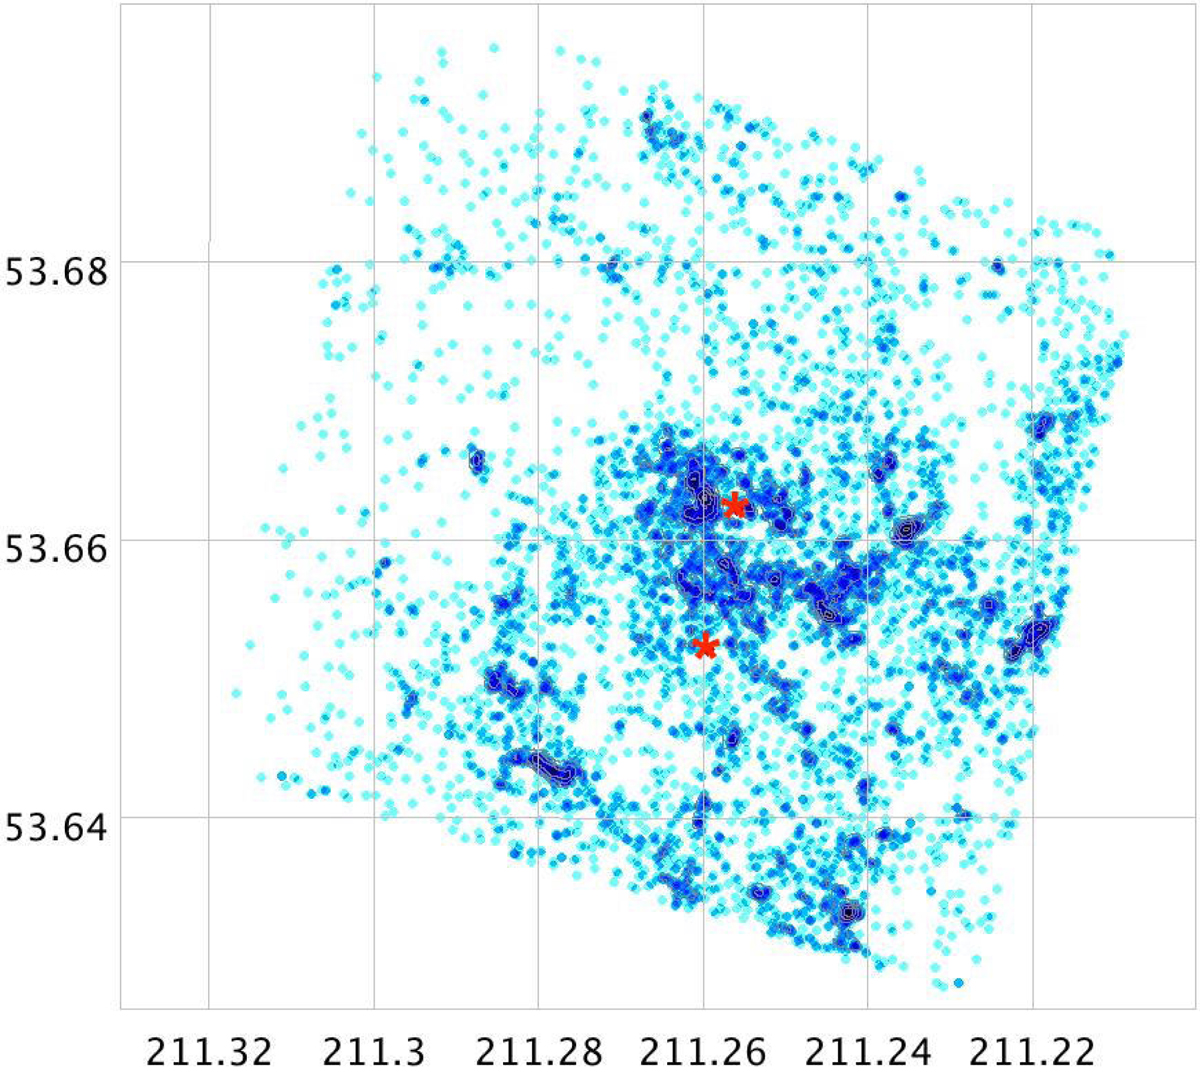
Density map of the YOUNG sample obtained with TOPCAT. The axis are RA and Dec (in degrees) in sin projection. North is up and east is to the left. The colour is proportional to the square root of the local density; darker tones of blue traces higher density levels. The two asterisk symbols superimposed on the map mark the position of the centre of the bulge and of the dynamical centre of the H I disc (from Rownd et al. 1994), from north to south, respectively.
Current usage metrics show cumulative count of Article Views (full-text article views including HTML views, PDF and ePub downloads, according to the available data) and Abstracts Views on Vision4Press platform.
Data correspond to usage on the plateform after 2015. The current usage metrics is available 48-96 hours after online publication and is updated daily on week days.
Initial download of the metrics may take a while.