Fig. 7.
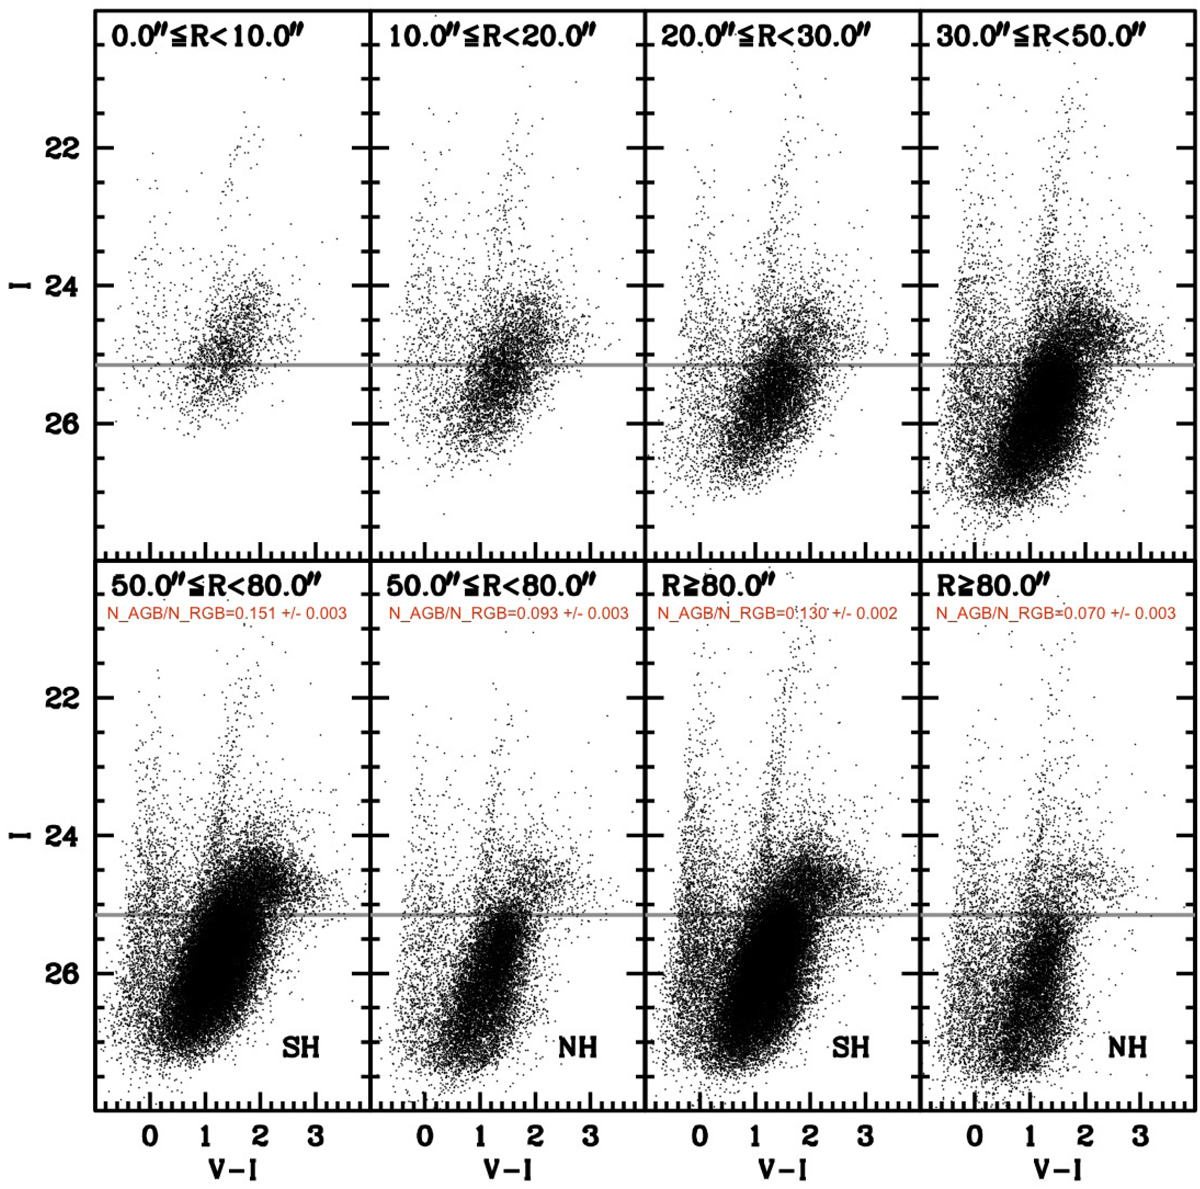
CMD in different radial annuli, from the centre of the bulge to the edge of the ACS image. For R ≳ 50.0″ we split the annuli in their northern and southern halves (NH and SH, respectively) in order to highlight the asymmetry in the surface density related to the SW over-density. In the corresponding panels, we also report the ratio between AGB and RGB stars. The horizontal grey line marks the position of the RGB tip as determined from the whole sample. This series of CMDs also clearly illustrate the severe effect of the increasing incompleteness towards the centre of the most crowded substructure, i.e. the bulge, with the limiting magnitude dropping by nearly 2 mag from R > 30.0″ to R < 10.0″.
Current usage metrics show cumulative count of Article Views (full-text article views including HTML views, PDF and ePub downloads, according to the available data) and Abstracts Views on Vision4Press platform.
Data correspond to usage on the plateform after 2015. The current usage metrics is available 48-96 hours after online publication and is updated daily on week days.
Initial download of the metrics may take a while.