Fig. 4.
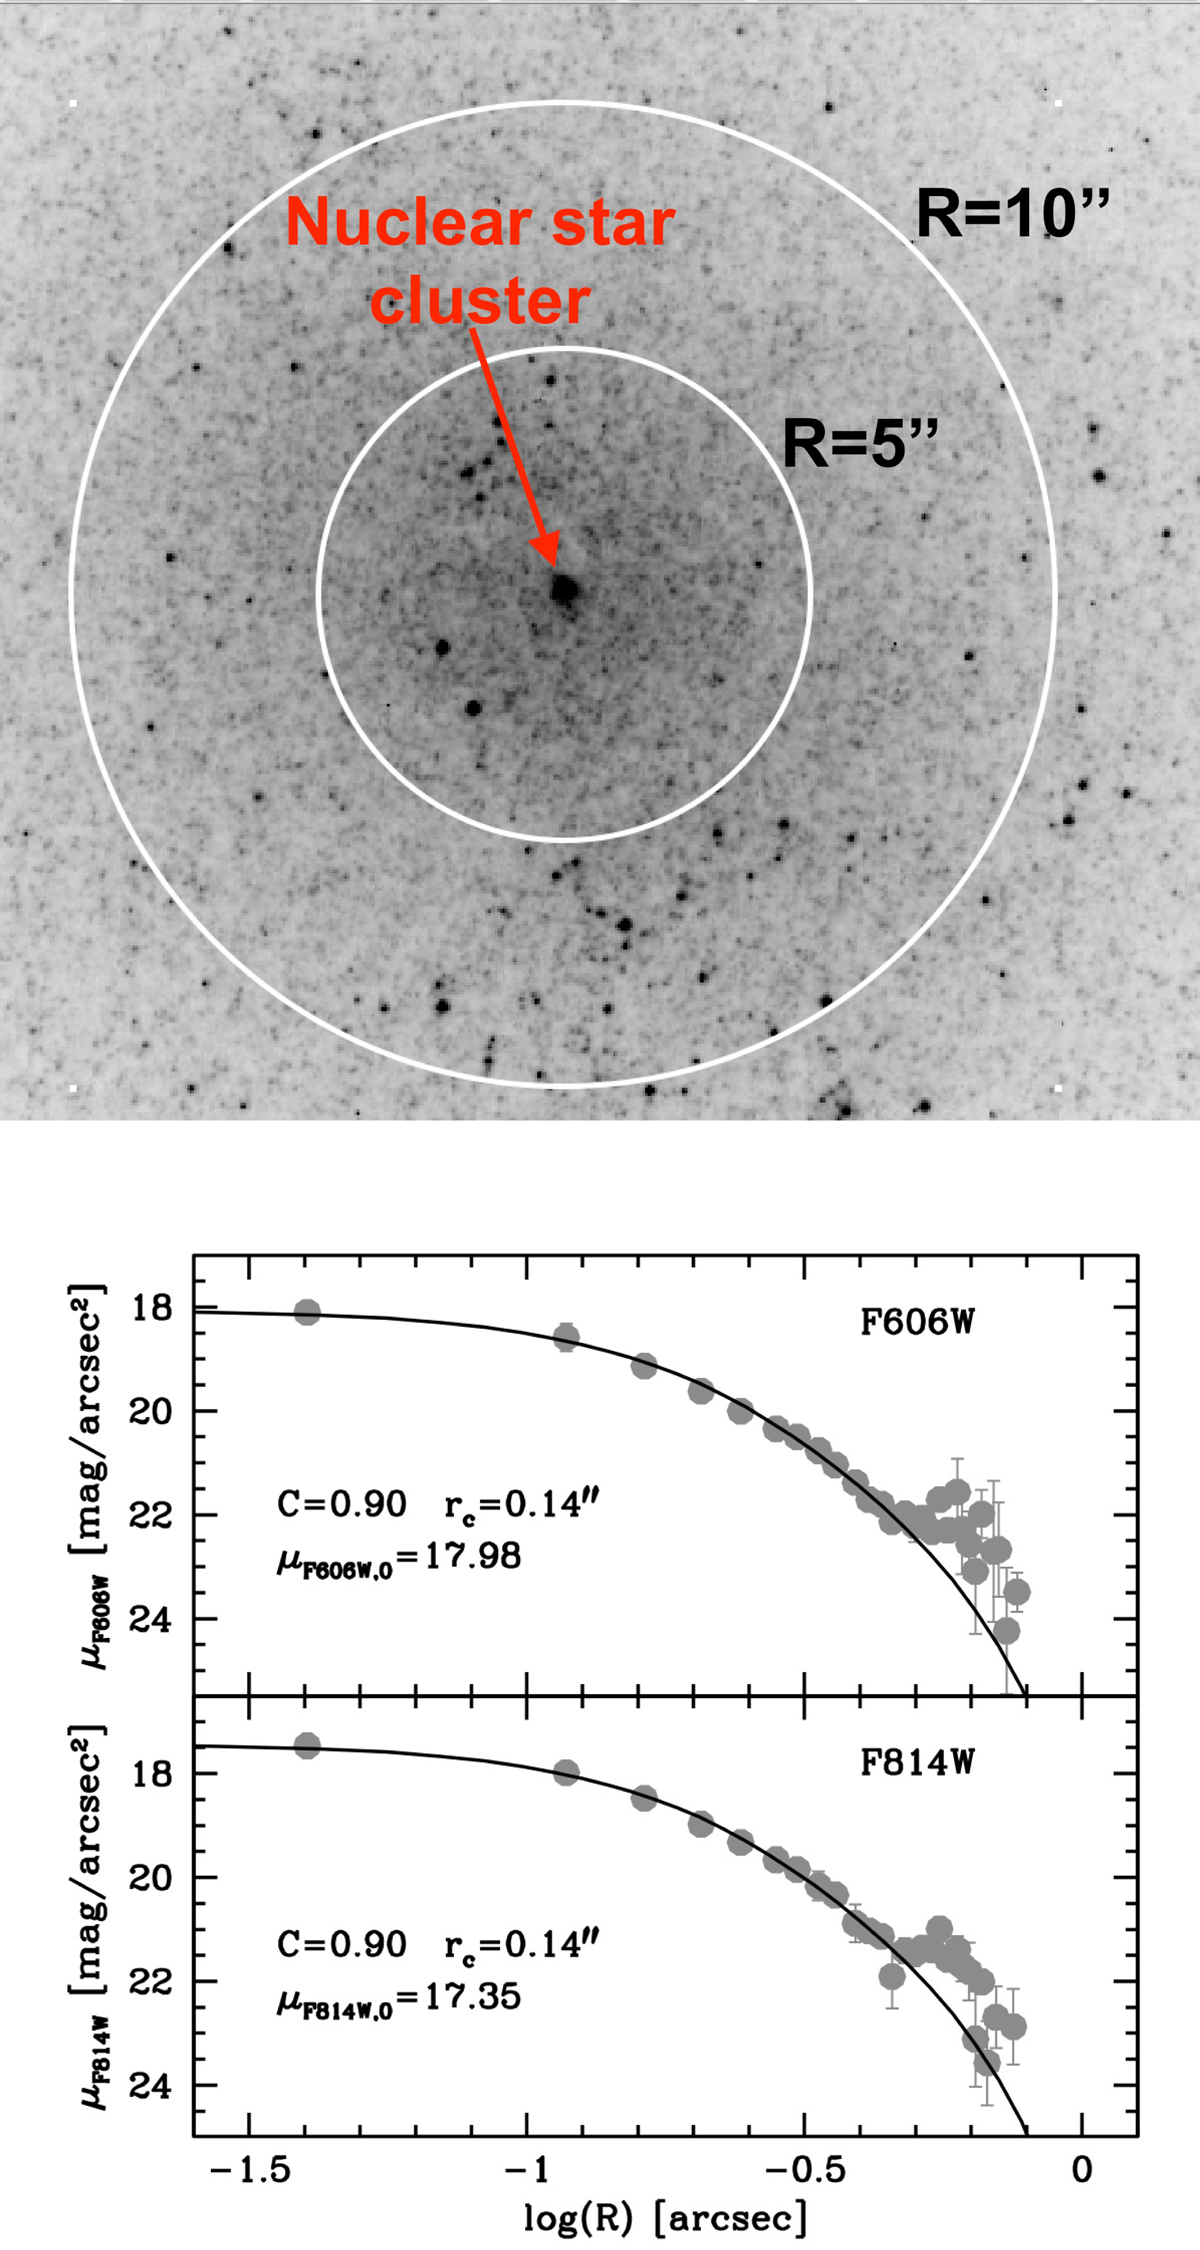
Upper panel: HST ACS F814W zoomed image of the central part of the bulge with intensity cuts chosen to make the stellar nucleus visible. The concentric circles provide the scale of the image and help the eye to appreciate that the nucleus resides at the centre of the bulge. Lower panel: surface brightness profile of the stellar nucleus in both the ACS bands. The continuous line displays the King (1966) model that fits the observed profiles. The parameters of the model are reported in the panels. The deviation from a smooth profile observed around log(R) = 0.75 is due to a relatively bright source projected onto the outskirts of the nucleus.
Current usage metrics show cumulative count of Article Views (full-text article views including HTML views, PDF and ePub downloads, according to the available data) and Abstracts Views on Vision4Press platform.
Data correspond to usage on the plateform after 2015. The current usage metrics is available 48-96 hours after online publication and is updated daily on week days.
Initial download of the metrics may take a while.