Fig. 1.
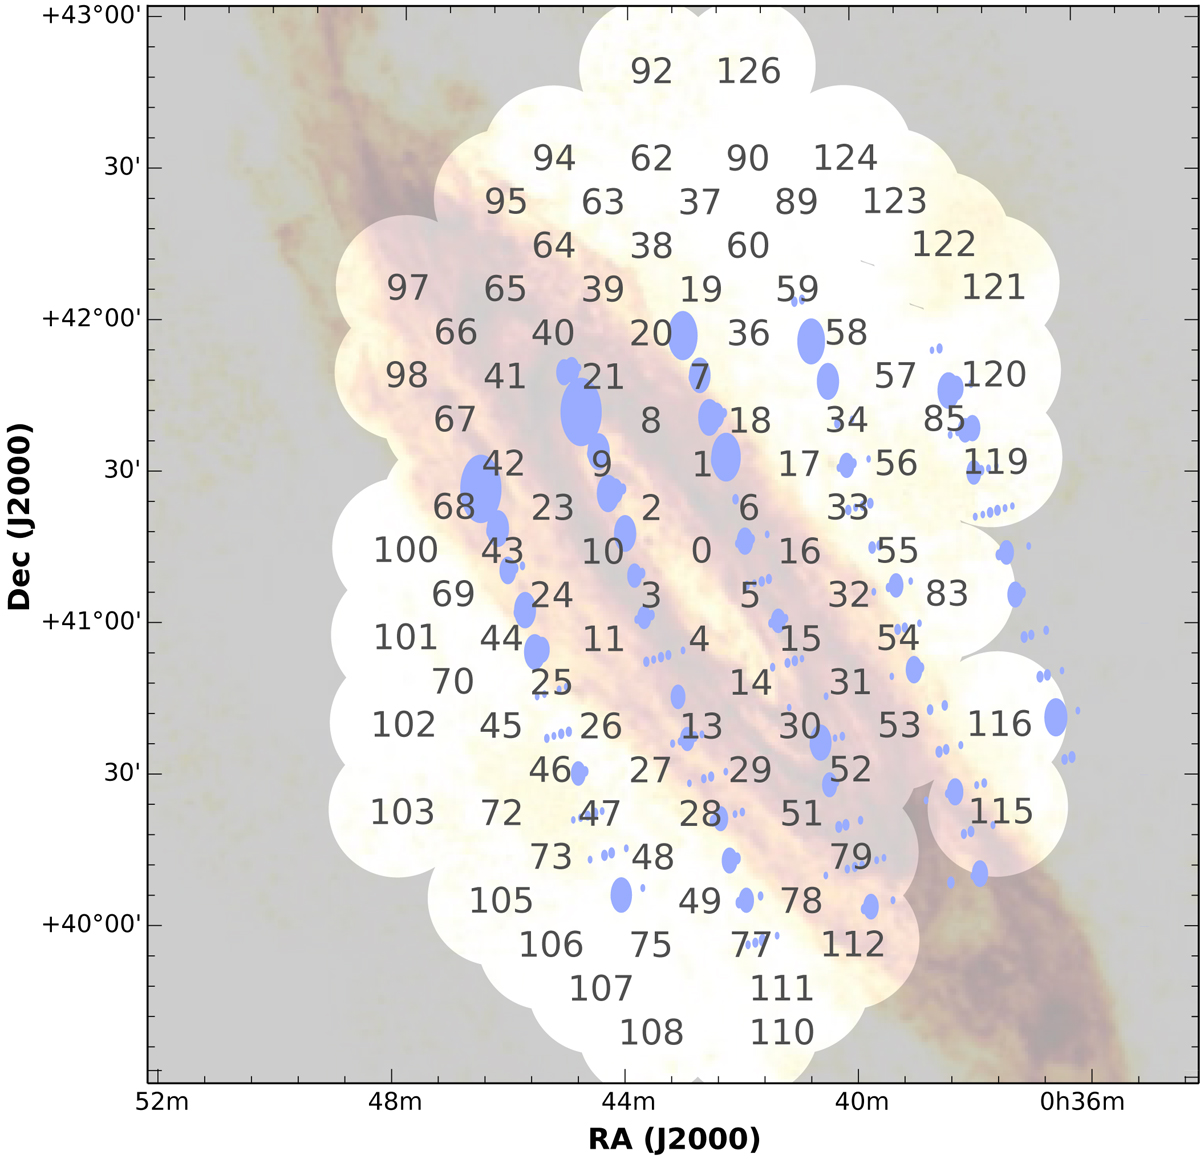
Combination of our 2011 beam pattern with the localization distribution of the DM = 54.7 pc cm−3 candidate from Rubio-Herrera et al. (2013) in blue. The overall outline and beam numbers over the 2011 observation are shown; the 25 absent beams failed initial processing. Because observations were taken around transit, the beams are close to circular. The size of the blue ellipses indicates the S/N of the DM = 54.7 pc cm−3 single-pulse detection in the WSRT subbeam at that location. In the background we show the H I peak brightness map at 60 arcsec and 6 km s−1 resolution, as observed with WSRT (Braun et al. 2009). The 91 tied-array beams pattern from 2014 is overlaid on a 10 h LOFAR imaging observation of M 31, adopted from M18.
Current usage metrics show cumulative count of Article Views (full-text article views including HTML views, PDF and ePub downloads, according to the available data) and Abstracts Views on Vision4Press platform.
Data correspond to usage on the plateform after 2015. The current usage metrics is available 48-96 hours after online publication and is updated daily on week days.
Initial download of the metrics may take a while.