Free Access
Fig. 4
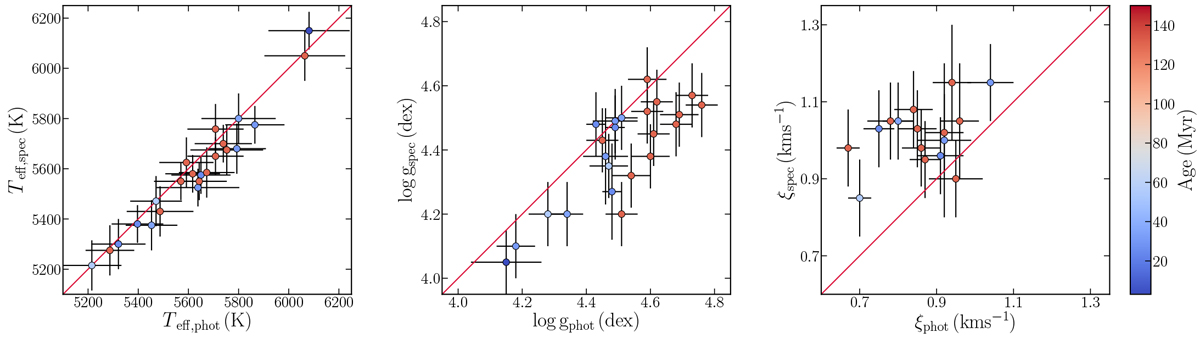
Comparison between the photometric and spectroscopic estimates of the atmospheric parameters. The red line represents the 1:1 relation. The points are colour-coded according to ages. The red points refer to NGC 2516, and the blue points to the younger clusters.
Current usage metrics show cumulative count of Article Views (full-text article views including HTML views, PDF and ePub downloads, according to the available data) and Abstracts Views on Vision4Press platform.
Data correspond to usage on the plateform after 2015. The current usage metrics is available 48-96 hours after online publication and is updated daily on week days.
Initial download of the metrics may take a while.