Fig. 10
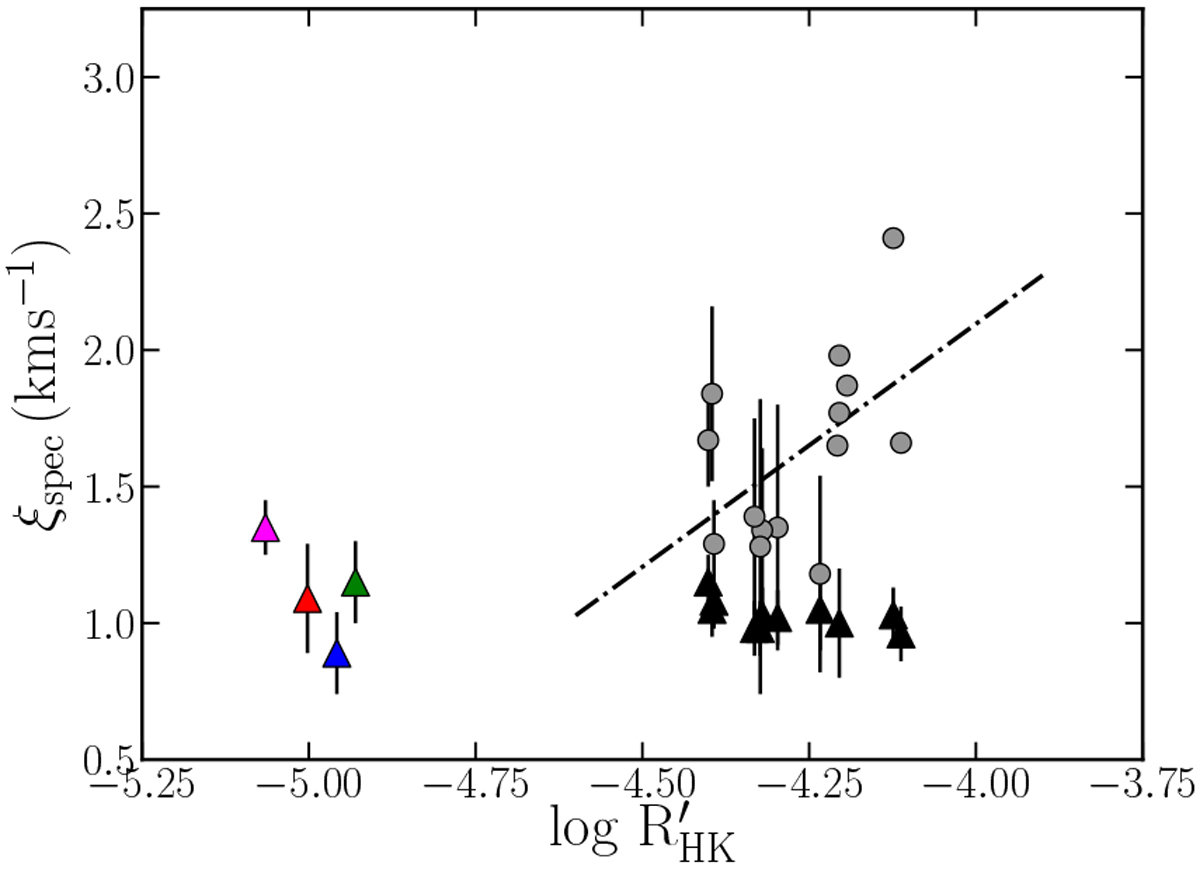
Activity index ![]() as a function of ξ values: the GESiDR5 results are represented with grey circles, and the triangles represent the values we find with our new method. The black triangles are the stars in the sample, and the coloured triangles represent the Gaia benchmark stars: red for α Cen A, green for 18 Sco, blue for τ Cet, and magenta for β Hyi. The dot-dashed line is the trend observed for the GES values.
as a function of ξ values: the GESiDR5 results are represented with grey circles, and the triangles represent the values we find with our new method. The black triangles are the stars in the sample, and the coloured triangles represent the Gaia benchmark stars: red for α Cen A, green for 18 Sco, blue for τ Cet, and magenta for β Hyi. The dot-dashed line is the trend observed for the GES values.
Current usage metrics show cumulative count of Article Views (full-text article views including HTML views, PDF and ePub downloads, according to the available data) and Abstracts Views on Vision4Press platform.
Data correspond to usage on the plateform after 2015. The current usage metrics is available 48-96 hours after online publication and is updated daily on week days.
Initial download of the metrics may take a while.