Fig. 5.
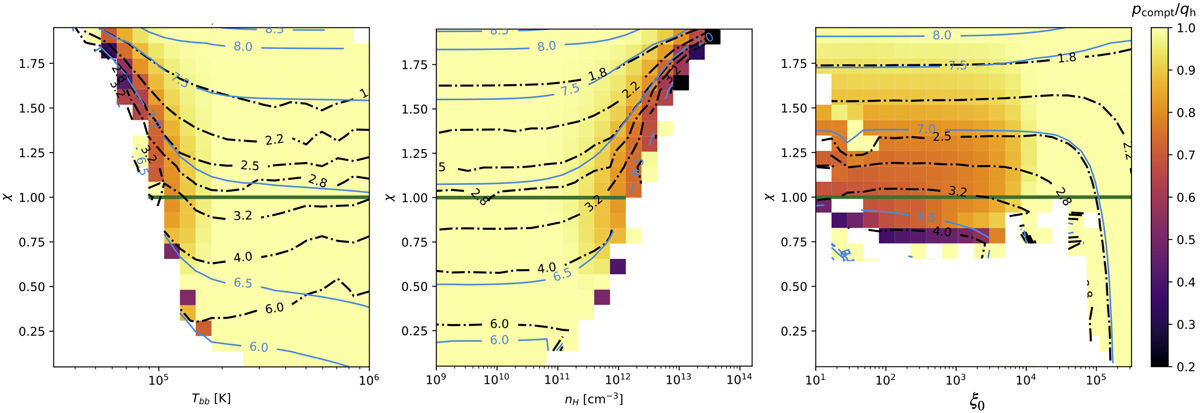
Contours of the warm corona temperature (blue lines) and the warm corona spectral photon index (black dashed lines) in the planes from left to right: χ–Tbb, χ–nH, and χ–ξ0. When Tbb, nH, or ξ0 are not variable they are fixed to Tbb = 105 K, nH = 1012 cm−3, and ξ0 = 103 erg s−1 cm. The corona optical depth τcor is fixed to 20. The background colors correspond to the Compton cooling to corona heating fraction whose color scale is reported on the right. Similarly to Fig. 2 the green line corresponds to the condition χ = 1.
Current usage metrics show cumulative count of Article Views (full-text article views including HTML views, PDF and ePub downloads, according to the available data) and Abstracts Views on Vision4Press platform.
Data correspond to usage on the plateform after 2015. The current usage metrics is available 48-96 hours after online publication and is updated daily on week days.
Initial download of the metrics may take a while.