Fig. 4.
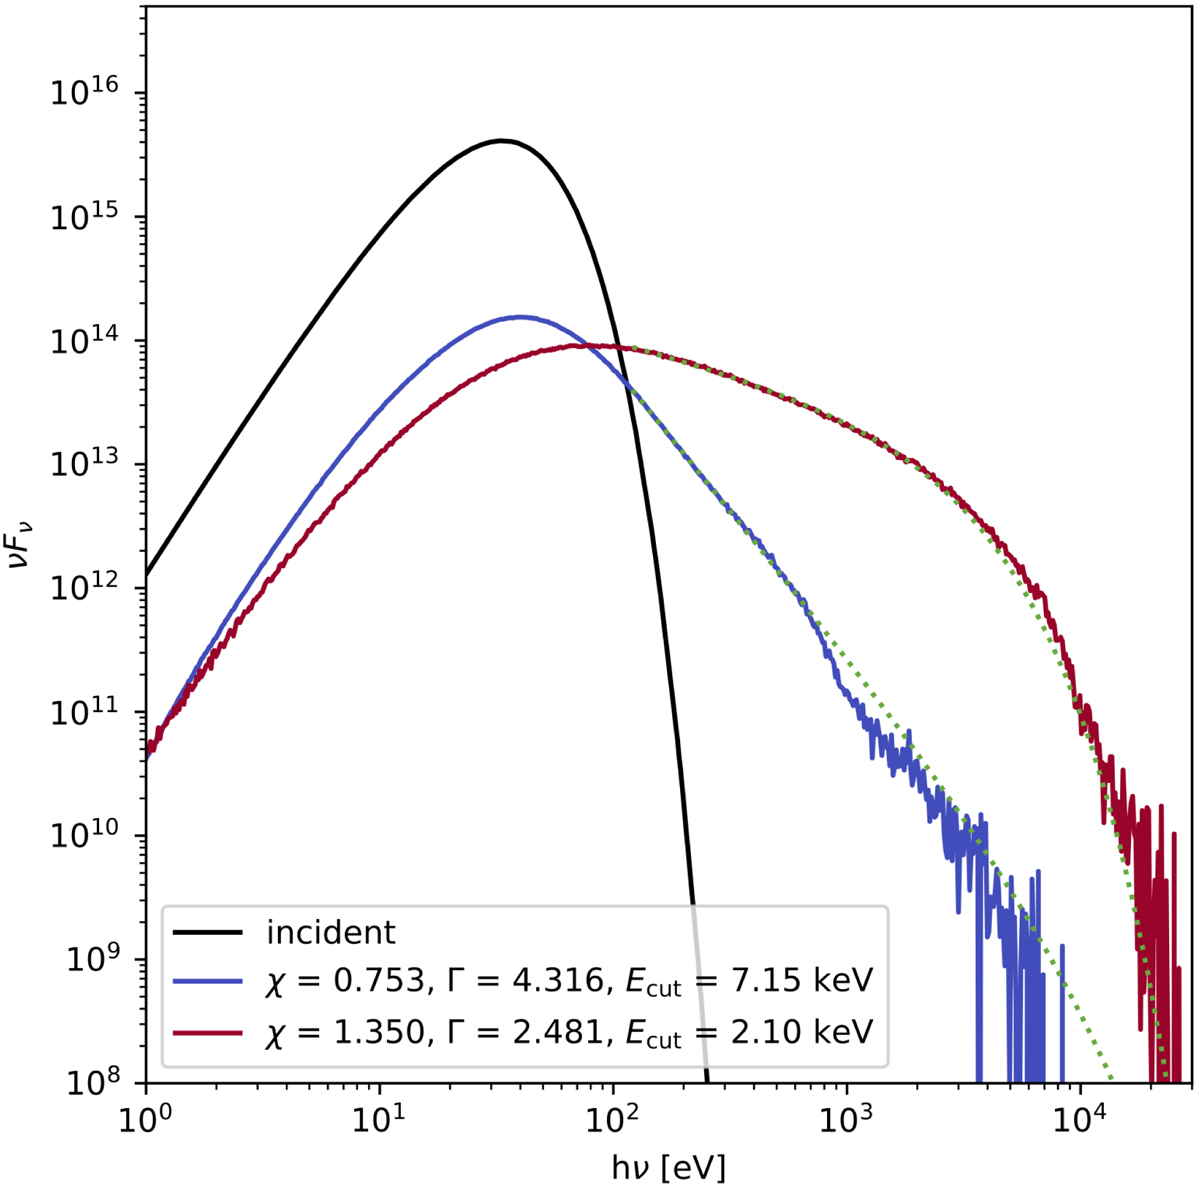
Two examples of simulated spectra emitted by the warm corona for τcor = 20 and two different values of χ: 1.35 (red) and 0.753 (blue). The best fit values for the photon index and high-energy cut-off when the spectra are fitted with a high-energy exponential cut-off power law are indicated in the figure. The simulation corresponding to the red spectrum is represented by the “x” in Fig. 3 and is in the parameter space which agrees with the spectral shape of the soft X-ray excess. On the contrary, the simulation corresponding to the blue spectrum is represented by the “+” in Fig. 3 and has a much steeper spectrum compared to the usual values of the soft X-ray excess. We also report in black the corresponding black-body spectrum emitted by the disk at the bottom of the warm corona.
Current usage metrics show cumulative count of Article Views (full-text article views including HTML views, PDF and ePub downloads, according to the available data) and Abstracts Views on Vision4Press platform.
Data correspond to usage on the plateform after 2015. The current usage metrics is available 48-96 hours after online publication and is updated daily on week days.
Initial download of the metrics may take a while.