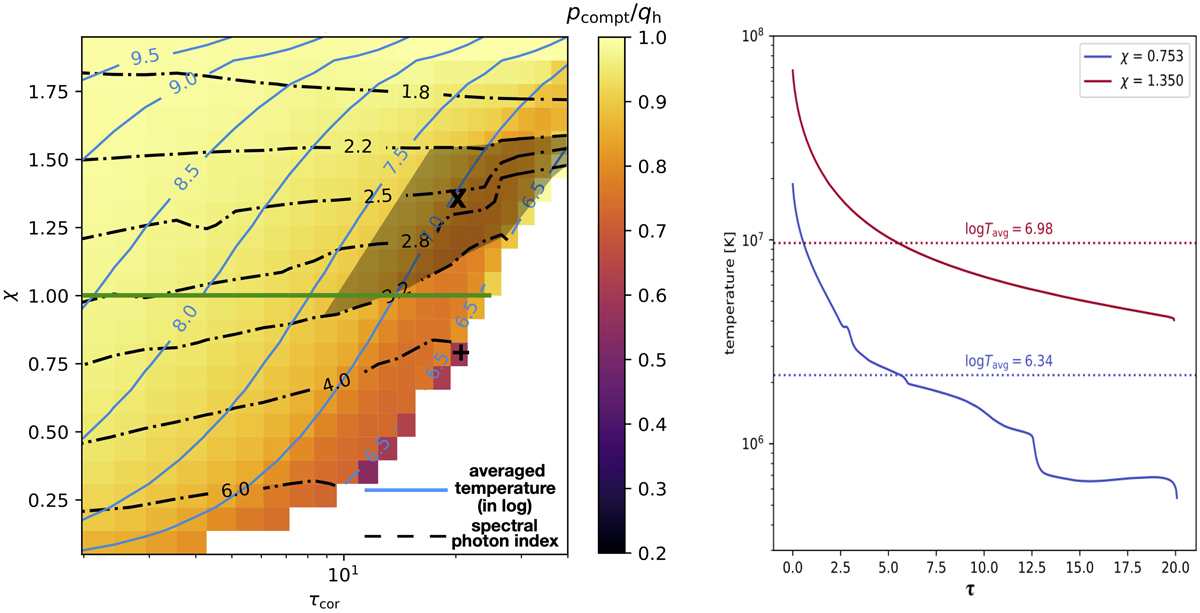
Fig. 3.

Left: same map as in Fig. 2 but with the contours of the logarithm of the vertical average coronal temperature (in Kelvin, blue solid line) and the contours of the photon indices of the output spectrum produced by the corona (black dot-dashed lines). The other parameters are fixed to Tbb = 105 K, ξ0 = 103 erg s−1 cm, and nH = 1012 cm−3. Similarly to Fig. 2 the green line corresponds to the condition χ = 1. The darkened area corresponds to the usual observational constraints of the temperature (0.1–2 keV) and photon index (2.2–3.2) of the soft X-ray excess. Right: vertical coronal temperature profiles for τcor = 20 and χ = 1.35 and 0.753. The corresponding average temperatures ![]() are indicated for each temperature profile.
are indicated for each temperature profile.
Current usage metrics show cumulative count of Article Views (full-text article views including HTML views, PDF and ePub downloads, according to the available data) and Abstracts Views on Vision4Press platform.
Data correspond to usage on the plateform after 2015. The current usage metrics is available 48-96 hours after online publication and is updated daily on week days.
Initial download of the metrics may take a while.


