Fig. 2.
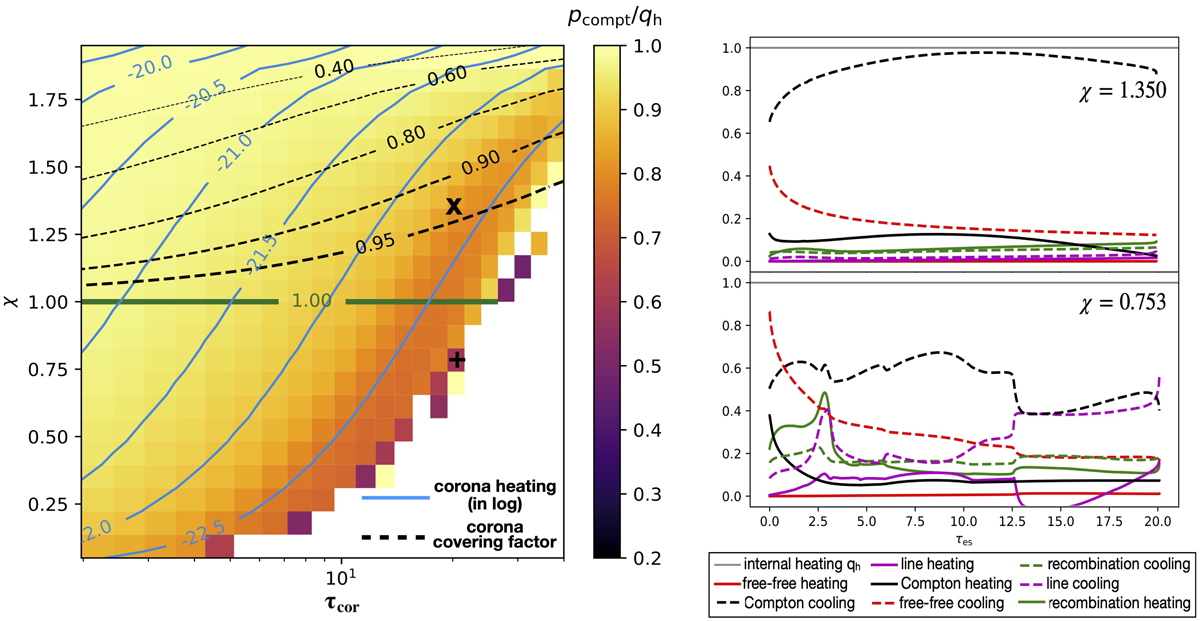
Left: map of the average Compton cooling ![]() to the warm corona heating (qh) ratio in the χ–τcor plane, with χ being defined by Eq. (12). The color scale on the right ranges from 20 (black) to 100% (white). The other parameters are fixed to Tbb = 105 K, ξ0 = 103 erg s−1 cm, and nH = 1012 cm−3. The solid green line refers to χ = 1, that is, the case of radiative equilibrium between a corona and a nondissipative disk that it covers entirely; it divides the χ–τcor into two regions that can be characterized by different radiative equilibrium properties (see Sect. 2). The region above the green line, that is, χ > 1, agrees with a nondissipative disk covered by a patchy corona. The dashed lines correspond to different values of the corona covering factor from 0.95 to 0.40 (see Eq. (A.9)). The region below the green line, that is, χ < 1, agrees with a slab corona above a disk which is now dissipative (Fdisk > 0). The blue contours correspond to different values of the logarithm of the warm corona heating qh (in unit of erg s−1 cm3). Right: cooling and heating process fractions with respect to the warm corona heating qh across the corona for τcor = 20 but for two different values of χ, 0.753 (bottom) and 1.35 (top). This corresponds to the simulations indicated in the left panel with either a “+” or an “x”, respectively.
to the warm corona heating (qh) ratio in the χ–τcor plane, with χ being defined by Eq. (12). The color scale on the right ranges from 20 (black) to 100% (white). The other parameters are fixed to Tbb = 105 K, ξ0 = 103 erg s−1 cm, and nH = 1012 cm−3. The solid green line refers to χ = 1, that is, the case of radiative equilibrium between a corona and a nondissipative disk that it covers entirely; it divides the χ–τcor into two regions that can be characterized by different radiative equilibrium properties (see Sect. 2). The region above the green line, that is, χ > 1, agrees with a nondissipative disk covered by a patchy corona. The dashed lines correspond to different values of the corona covering factor from 0.95 to 0.40 (see Eq. (A.9)). The region below the green line, that is, χ < 1, agrees with a slab corona above a disk which is now dissipative (Fdisk > 0). The blue contours correspond to different values of the logarithm of the warm corona heating qh (in unit of erg s−1 cm3). Right: cooling and heating process fractions with respect to the warm corona heating qh across the corona for τcor = 20 but for two different values of χ, 0.753 (bottom) and 1.35 (top). This corresponds to the simulations indicated in the left panel with either a “+” or an “x”, respectively.
Current usage metrics show cumulative count of Article Views (full-text article views including HTML views, PDF and ePub downloads, according to the available data) and Abstracts Views on Vision4Press platform.
Data correspond to usage on the plateform after 2015. The current usage metrics is available 48-96 hours after online publication and is updated daily on week days.
Initial download of the metrics may take a while.