Fig. 4.
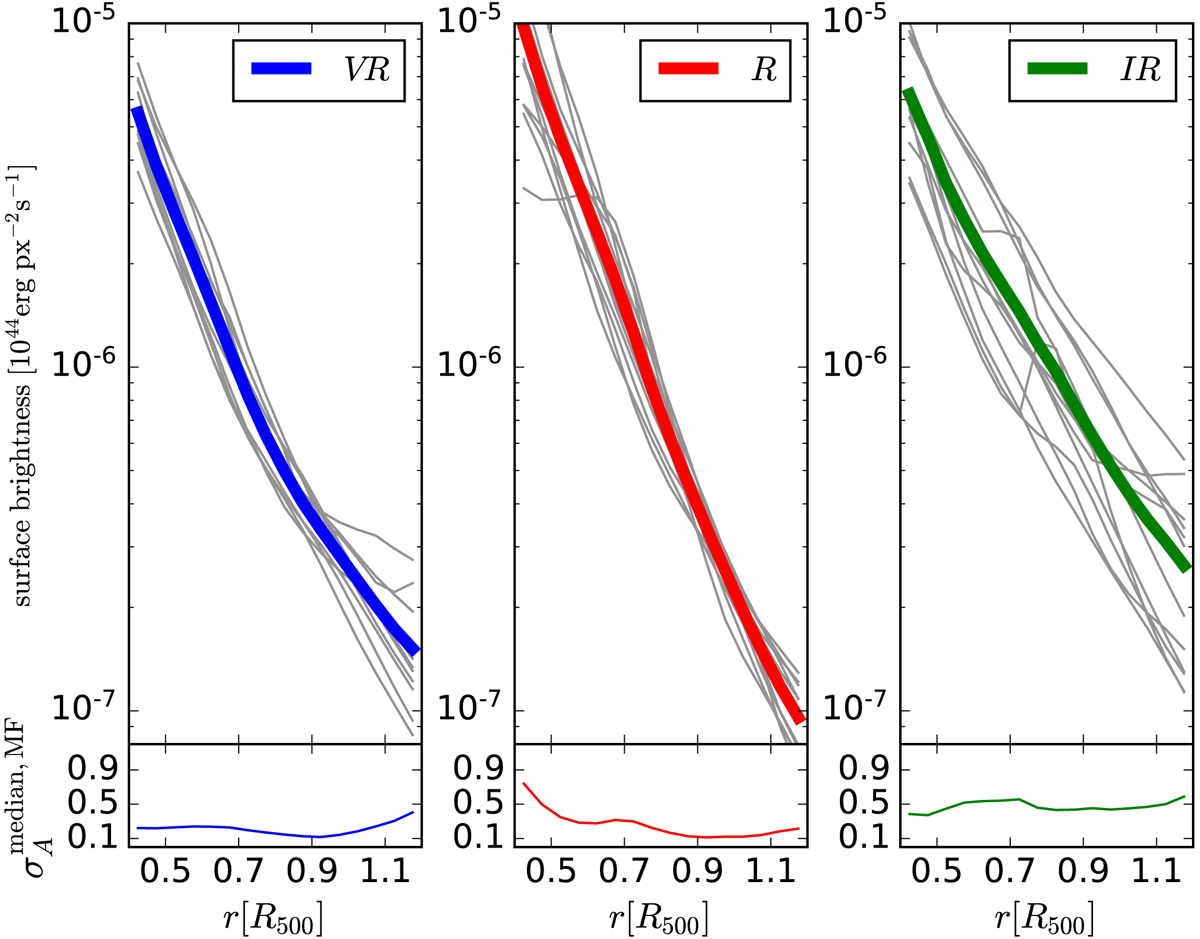
Upper panels: surface brightness profiles (gray lines) extracted from the 12 sectors centered on MF of the three images of Fig. 1, representative of the classes: VR (left panel), R (central panel), and IR (right panel). The thick solid lines show the mean profile. The median profile is not shown for clarity. Lower panels: azimuthal scatter profiles derived as in Eq. (2) and computed with respect to the median profile and centered on MF, ![]() , for clarity simply referred to as σA in the plot.
, for clarity simply referred to as σA in the plot.
Current usage metrics show cumulative count of Article Views (full-text article views including HTML views, PDF and ePub downloads, according to the available data) and Abstracts Views on Vision4Press platform.
Data correspond to usage on the plateform after 2015. The current usage metrics is available 48-96 hours after online publication and is updated daily on week days.
Initial download of the metrics may take a while.