Fig. 16.
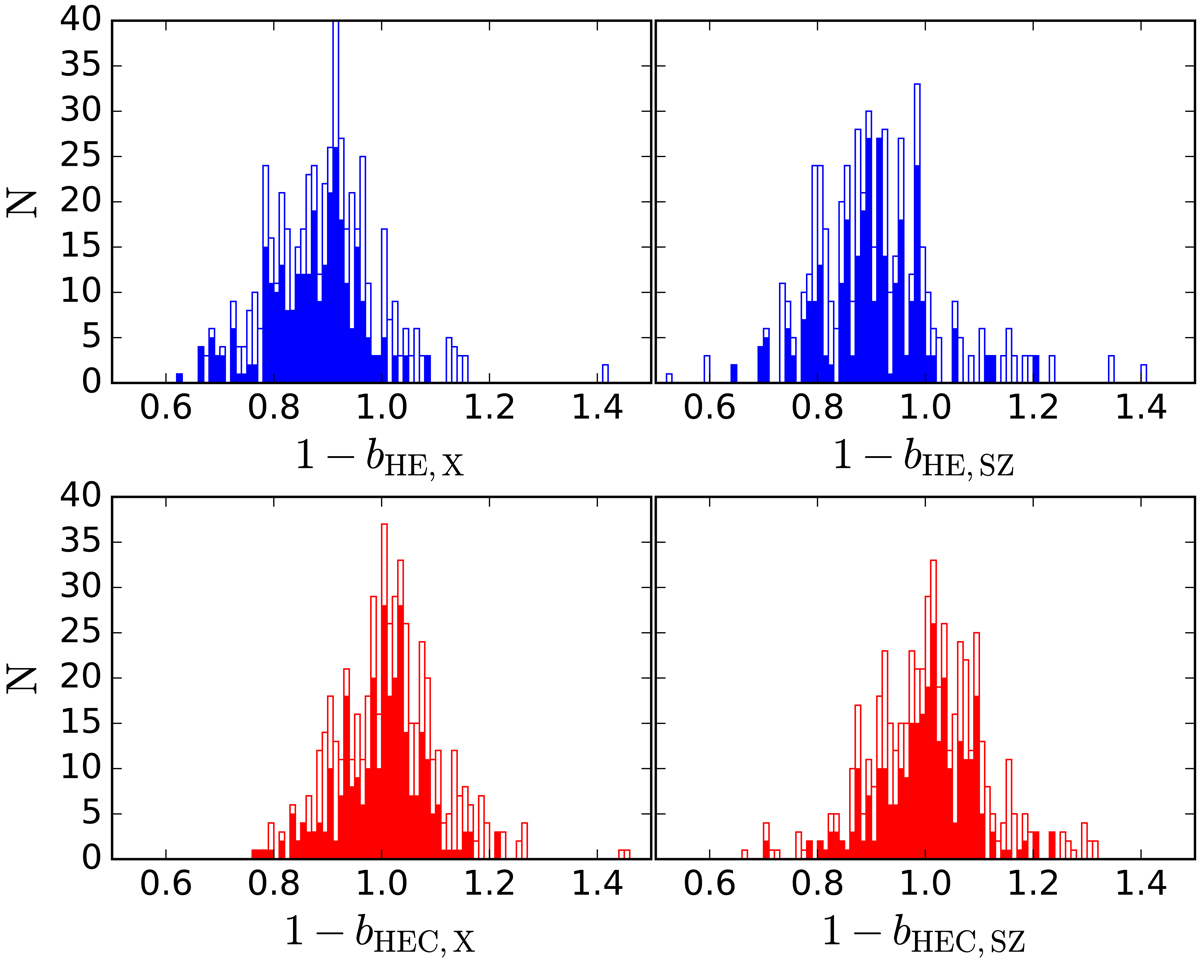
Distribution of the mass biases, (1 − bHE, X), on the left, and (1 − bHE, SZ), on the right, before (top panels) and after (bottom panels) the corrections expressed respectively in Eqs. (16) and (17). The empty histograms show the overall distribution of all the 175 clusters, the filled histograms are restricted to the 97 well-fitted objects. The parameters characterizing the histograms are reported in Table 2.
Current usage metrics show cumulative count of Article Views (full-text article views including HTML views, PDF and ePub downloads, according to the available data) and Abstracts Views on Vision4Press platform.
Data correspond to usage on the plateform after 2015. The current usage metrics is available 48-96 hours after online publication and is updated daily on week days.
Initial download of the metrics may take a while.